
Official websites use .gov
A .gov website belongs to an official government organization in the United States.
Secure .gov websites use HTTPS
A lock (
) or https:// means you’ve safely connected to the .gov website. Share sensitive information only on official, secure websites.
Summary
The primary motivation for this work is the fire in the World Trade Center towers, which generated an urgent need to better understand evacuation procedures in cases of fire in other high rise buildings. In this study building evacuation processes are modeled as a Hawkes point process.
Description
Results from a case study of evacuations of 14 office and residential buildings in the United States led us to model occupant exit times as a Hawkes point process, N(t). N(t) the number of evacuee exits in the time interval (0,t]. Because the Hawkes model is self-similar, human to human interaction in a stair is more accurately captured than in existing models. In a self-exciting process, the occurrence of one event increases the probability of the occurrence of future events. This is exactly what happens in occupant egress; a slow moving evacuee impedes and slows down evacuees behind and usually generates a cluster of followers until someone passes.
Fire drills from 14 office and residential buildings throughout the United States were monitored and recorded using video cameras placed in stairs at alternating floor locations. The descent path of each occupant was monitored and resolved from this video footage. Buildings ranged from 6 stories to 62 stories, with each having multiple stairs. There are a total of 31 stairs and the number of occupants per stair ranged from 42 to 665. One stair was dropped, because of the small number of occupants. A large amount of data per occupant was retrieved from the video footage, e.g. floor speeds, pre-evacuation times, travel times, total evacuation times, travel speeds, gender, body size, etc. Also, stair densities were recorded. Total evacuation time is defined as the sum of the pre-evacuation time and the travel time. Pre-evacuation time is defined as the time from the initial alarm until the occupant was seen entering the stair. Travel times were recorded as the elapsed time between entrance to a stair until crossing the exit threshold, as indicated from the video footage. Also, speeds and travel times from camera position to camera position were recorded. Stair geometry may effect movement of occupants. So, stair riser heights, stair treads, stair effective widths, landing areas were recorded. There are several point processes in this study. We looked at the total evacuation times.
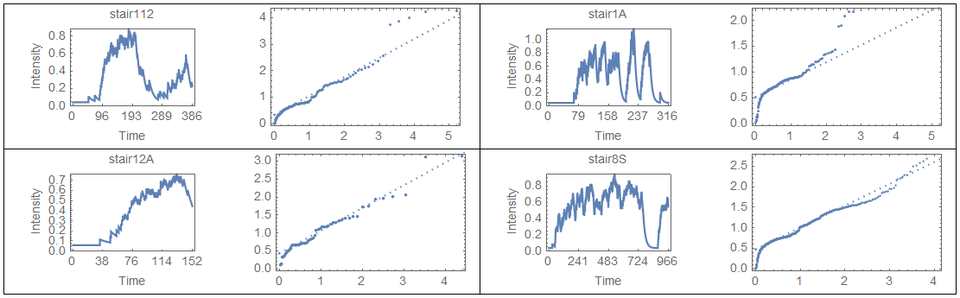
Hawkes processes are described by their intensity functions and they can be estimated using maximum likelihood estimation. The data are intensity functions for each stair. Expressions for occupant flow rate, N(t)/t, were determined in terms of Hawkes intensity parameters. Functional data analysis was used to compare intensity functions and to perform statistical analyses.
Below are shown Hawkes intensities and QQ plots for MLE fits for several stairs.
Major Accomplishments
Flow rate is shown to be a function of the Hawkes branching ratio and an evacuation optimality criterion in terms of the branching ratio was derived. Functional data analysis was applied to Hawkes intensities to determine building to building variability and functional regression was used to determine how stair geometry affects efficiency of evacuations.