Official websites use .gov
A .gov website belongs to an official government organization in the United States.
Secure .gov websites use HTTPS
A lock (
) or https:// means you’ve safely connected to the .gov website. Share sensitive information only on official, secure websites.
Summary
The standard addition method (SAM) was first described by oceanographers in 1955 to overcome matrix effects in the determination of strontium in seawater. SAM is a core Inorganic Chemical Metrology Group (ICMG) capability for the value assignment of trace elements and metal-containing species in NIST SRMs. The method uses the sample as the calibration curve by adding known varying amounts of the element to be determined to a series of aliquots of the unknown. It is the method of choice for high-accuracy determinations of monoisotopic elements by inductively coupled plasma mass spectrometry (ICP-MS), but the method has applicability to a number of unrelated fields. SAM has been used to determine sulfur in a new biodiesel SRM by X-ray fluorescence spectrometry (XRF). Research is ongoing to optimize SAM using Monte Carlo (MC) simulation with the goal to minimize uncertainty and to multiplex the method.
Description
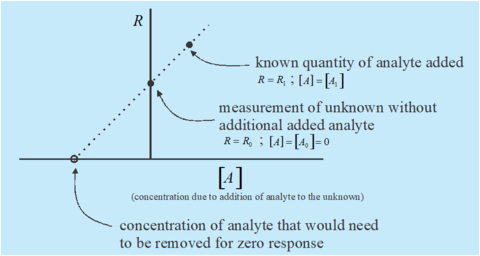
Plot illustrating the principle of standard addition method for quantitation.
This project is focused on improving the accuracy, uncertainty, and efficiency of SAM by experimental design and MC simulation, and then implementing it in technical protocols for analysis of SRMs and other samples. Improvements will be disseminated through peer-reviewed publications. These studies include:
- Determining the optimum experimental design for SAM that is unbiased and minimizes uncertainty in the measurand.
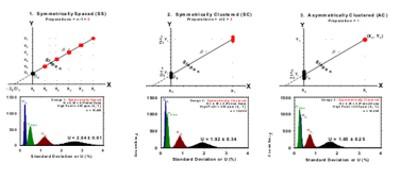
- Investigating weighted and unweighted regression in the context of symmetrically spaced (SS), symmetrically clustered (SC), and asymmetrically clustered (AC) calibration approaches.
- Improving and refine the technical procedure for SC standard additions as currently applied to multi-element measurements.
- Developing a user-friendly software program to calculate the best fit location estimate and corresponding dispersion for a given set of data using the SC design.
Major Accomplishments
- The optimal AC design for MSA has been solved on a theoretical basis.
- A technical procedure and associated software program have been developed for estimating the location estimate and its associated uncertainty using the SC design, where uncertainty is assigned using MC approaches.
- Both the AC and SC approaches represent an improvement in experimental design when compared with the classical symmetrically spaced (SS) calibration approach.
Additional Technical Details
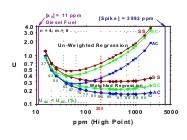
The theoretical foundation of SAM is being studied by MC simulation to find the optimum experimental design with the assumption of a fixed number of samples (n) and measurements (m). The initial focus is on heteroscedastic data that obey Poisson statistics and use weighted least squares regression to obtain the parameter estimates. An optimum design for the SAM must meet at least four criteria: 1) it must yield the best estimate of the intercept (β0) and slope (β1) and be practically unbiased, 2) it must have the coverage interval claimed, 3) it must yield the lowest uncertainty, and 4) it must require less effort than other designs. The SS and SC designs have been popularly used (Figure 1). Our research demonstrates that the AC design is superior to both SS and SC designs. The AC requires the spiking of only a single sample, and is therefore 5 times more efficient compared to the traditional SS design. It is more precise as shown in the three histograms, which illustrate the distributional characteristics of standard deviations of the regression parameters. In all cases the standard deviation of the intercept (β0) is the biggest component of U, and U has a much higher dispersion for Design 1 (SS) compared to Design 3 (AC). The log-log plot (Figure 2) shows the 95 % confidence interval (CI) for spiking a diesel fuel sample of 11 mg/kg with different amounts of an SRM diesel fuel (3882 mg/kg) for determination by X-ray fluorescence spectrometry (XRF). If homoscedasticity were incorrectly assumed and the data were reduced using un-weighted least squares, then the uncertainties would be biased high.
The term multiplex is used to describe a variation of single-point standard additions wherein multiple units of an SRM are spiked to build the calibration curve and multiple elements are spiked into the sample simultaneously, with the key advantage being a reduction in the number of analytical samples required for measurement. The calibration curve generated for the SRM is often used to predict mass fraction data for control materials of a similar matrix. Often this method is applied to SRM value assignment of several mono-isotopic elements simultaneously, using collision cell technology (CCT-) ICP-MS, but it can be used in any situation where an analyte and an internal standard can be mixed to yield a homogeneous sample.
In practice, it has been determined that the uncertainty due to extrapolation, uex, is one of the largest sources of uncertainty for this calibration scheme. MC analysis is typically employed to estimate the uncertainty about the X-intercept.
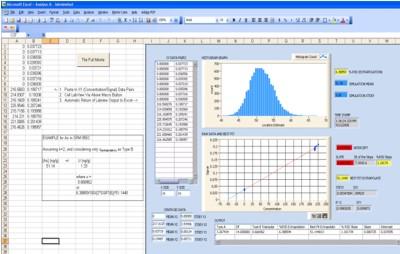
A custom LabView MC simulation program has been developed to estimate a relative standard uncertainty for the regression parameters. The program returns data in graphical and spreadsheet form as shown in Fig. 3 for arsenic in SRM 955c Caprine Blood. It first performs a linear regression analysis and outputs the best fit location estimate and additional data needed for the uncertainty calculations. An MC simulation is performed, and centroid means and standard deviations are calculated (see Fig 3. white boxes) for the XY data clusters, which essentially condenses the data into a two-point calibration curve, with each point possessing a two-dimensional cloud of uncertainty. The MC slope and intercept outcomes are generated, and these are constrained about the centroid points through repeat random sampling, assuming a normal distribution.
Both Type A uncertainty and Type B uncertainty approaches have been applied to resultant data, with the Type B approach yielding more reasonable estimates of uncertainty. The Type A or Type B extrapolation uncertainty is estimated by first performing 10,000 MC trials of possible slope/intercept combinations to obtain a location estimate reflecting the concentration of analyte in the SRM, and a corresponding relative standard deviation (RSD) due to the extrapolation (see Fig 3. histogram and associated data boxes).
Future work will involve applying and testing the AC design to multiplex standard additions (MSA).