
Official websites use .gov
A .gov website belongs to an official government organization in the United States.
Secure .gov websites use HTTPS
A lock (
) or https:// means you’ve safely connected to the .gov website. Share sensitive information only on official, secure websites.
Summary
The heterogeneity of the four elements in a TiAl(NbW) SRM 2061 alloy were determined from five specimens with WD-EPMA (wavelength dispersive – electron probe microanalysis) using (1)X-ray stage mapping (XSM) and (2)a random point (RP)nested-design testing procedure developed at NIST for standards certification. For both procedures x-ray data were acquired simultaneously from four stationery spectrometers each peaked on a single element. The overall uncertainties determined from XSM were as much as 50 % greater than the values determined from the RP procedure in spite of the fact that the number of points analyzed from XSM were 2500 while only 45 were analyzed by the RP procedure. The difference is in part attributed to the lower counting statistics observed in the XSM procedure. Also, the XSM procedure was not as efficient since it took three hours per sample map while the RP procedure was complete in less than two hours.
Description
X-ray stage mapping (XSM) can be used to determine the extent of heterogeneity on the micron scale though it is more time consuming and not as accurate as the more rigorous NIST random-point (RP) testing procedure. The objective of this work is to demonstrate the advantage of the latter procedure.
The NIST RP procedure using WD-EPMA heterogeneity testing for certification of microanalysis SRMs repeatedly samples (2 or 3 times) several (at least seven) randomly selected points on each of several bulk specimens being evaluated for certification. From the on-peak X-ray data, the known or estimated element mass fraction, and the background counts, a between points variance (s2PW), a between specimen variance (s2SW), and a measurement variance (s2EW) are determined for each analyzed element. The overall variance (s2W) in mass fraction concentration is the sum of these individual contributions, s2W= s2SW+ s2PW+ s2EW (1).
Results from the RP procedure using a group of five TiAl(NbW) SRM 2061 alloy specimens (from the same fabrication batch) were compared to XSM uncertainties determined from the same specimens, but using a slight modification of the statistical evaluation. TiAl(NbW) was selected because it exhibits heterogeneity for both major and minor elements. For both procedures, we used a 20 kV excitation potential and a 30 nA current with diffracting crystals TAP for AlKa, PET for TiKa and NbLa, and LiF for WLa. WD data was acquired simultaneously at the peak maximum from the four fixed spectrometers. Nine randomly selected points on each specimen were each read three times for 20 s for the RP sampling procedure. XSM data was acquired from points 2 mm apart in 50 pt x 50 pt arrays but each point only was sampled only once for 4 s. Since XSM did not allow repeated samplings, only a combined estimate of s2PW+ s2EW could be obtained that serves as a surrogate estimate of the baseline noise.
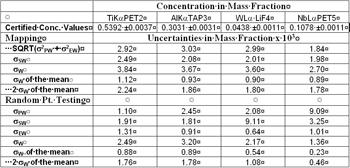
In the Table 1 are the 1s uncertainties in mass fraction for the two procedures. At the top are the NIST SRM certified values with the expanded uncertainties (k=2, 95 % confidence) of the mean for each element. These expanded uncertainties include the heterogeneity uncertainty as well as the uncertainties in the bulk chemical analyses determined from similar specimens of this SRM®. The 2sW uncertainties of the mean for the two heterogeneity procedures are included for comparison with the certified expanded uncertainties. All XSM uncertainties are greater than those observed in the RP testing procedure, especially for the minor elements where they are sometimes more than 50 % greater. This experiment demonstrates that mapping is not sufficient for certification purposes where the individual variance components should be accurately estimated, but mapping may be useful for other purposes where a coarser estimate of uncertainty is acceptable.
Since the completion time for the RP procedure was less than 2 hours compared to three hours for each of the five maps, the RP procedure with better statistics per point is certainly the more efficient testing procedure. In addition specimen flaws can be more easily avoided with the RP procedure.
Major Accomplishments
- This data was presented as an invited talk at the ACMM20/IUMAS IV meeting in Perth, Australia, Feb. 10-15, 2008.
Marinenko, R. B., Leigh, S., and Strawderman, W., A WD-EPMA Heterogeneity Testing Comparison of Mapping with a Random Point Analysis Procedure, Griffin, B. J., ed., Proc. ACMM-20 & IUMAS IV meeting, Feb. 10-15, 2008, Perth, Western Australia. p. 333.