Official websites use .gov
A .gov website belongs to an official government organization in the United States.
Secure .gov websites use HTTPS
A lock (
) or https:// means you’ve safely connected to the .gov website. Share sensitive information only on official, secure websites.
Summary
NIST's versatile wind tunnel is used to calibrate customers' airspeed sensors and to conduct research on the design of novel anemometers, the responses of anemometers to pitch, yaw, turbulence, and to study wall and blockage effects.
Description
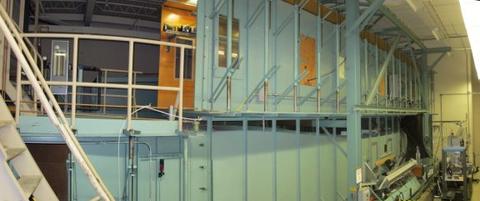
NIST's wind tunnel has two interchangeable test sections. (See Fig. 1) The upper test section has a uniform cross section; the lower test section has a contracted zone in its center to achieve higher velocities.
- Upper test section: 2.1 m high × 1.5 m wide × 12 m long; speeds to: 45 m/s (100 mi/hour)
- Lower test section: 1.2 m high × 1.5 m wide × 2 m long; speeds to: 75 m/s (165 mi/hour)
Calibrations are traced from a disk of known diameter and rotational frequency to working standards: a laser Doppler anemometer and pitot tubes. The fractional uncertainty (at 95% confidence level) of the working standards is (0.0044 + 0.0016/u2), where u is the airspeed in m/s. (see Shinder et al.,2013 and related publication #1)
The lower test section is used to calibrate customers' anemometers and to conduct research directed towards improving airspeed measurements. Recently, NIST began calibrating anemometers as a function of airspeed, pitch angle, yaw angle, and turbulence intensity. NIST provides customers with information on the “tilt response” of their airspeed instruments, allowing corrections or realistic uncertainty estimates for the misalignment of the instrument with the airspeed direction.
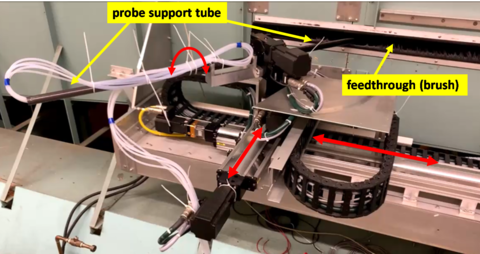
Anemometers undergoing calibration in the lower test section can be mounted on a “probe holder” that is supported by a computer-controlled stage (See Fig. 2). The stage points the anemometer at user-selected pitch and yaw angles with respect to the wind direction. The angular ranges are: yaw ±180°; pitch ±45°, both with expanded uncertainties ±0.3°. The computer-controlled system can acquire data at a rate of 300 points / hour.
In normal use, the turbulence intensity in NIST's wind tunnel is 0.07 %. We define the turbulence intensity as $$\sqrt{ \left( \vec{u} - \left< \vec{u} \right> \right)^2 } / \left< \vec{u} \right>,$$ where $$(\vec{u})$$ is the mean velocity. The turbulence intensity can be varied between 0.07 % to 25 % by inserting turbulence generators (e.g. grids) upstream of the test section.
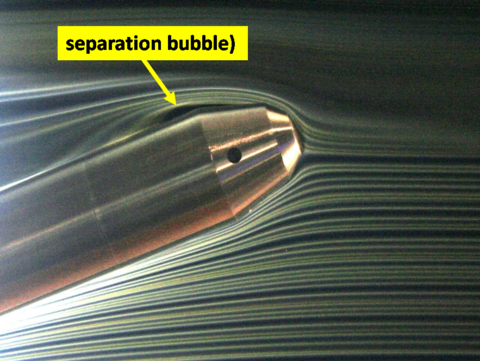
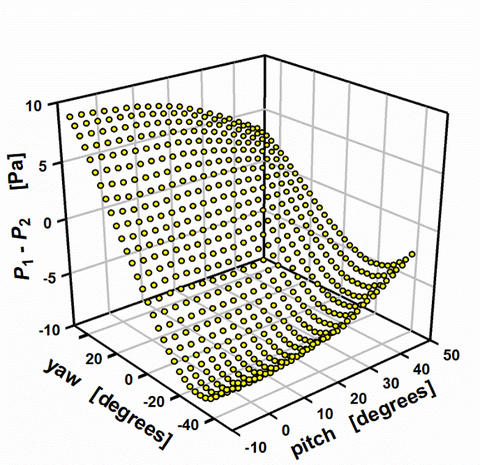
NIST demonstrated that flow separation generates hysteresis in the calibration of a multi-hole (so-called "3-dimensional" or "3-D") pitot tube in certain ranges of airspeed, turbulence, pitch angle, and yaw angle. (See Fig. 3 and Crowley et al., 2013.) As the turbulence intensity increased to 1%, the hysteresis gradually vanished; however, the calibration function was turbulence-dependent up to a turbulence intensity of at least 2%. Therefore, multi-hole pitot tubes used to measure turbulent flows should be calibrated in similar turbulent flows.
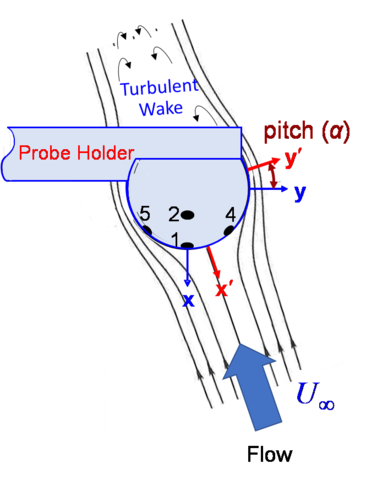
NIST is using the wind tunnel and Smokestack Simulator to improve the measurement of large flows in ducts like power plant smoke stacks. NIST designed and tested new 3-D pitot sensors (see related publication #2 and Fig. 4) and profiling methods for flue-gas measurements that are four times faster than existing methods and reduce the measurements’ uncertainty from as much as 20 % to less than 2 %.