
Official websites use .gov
A .gov website belongs to an official government organization in the United States.
Secure .gov websites use HTTPS
A lock (
) or https:// means you’ve safely connected to the .gov website. Share sensitive information only on official, secure websites.
Calibration of turbine meters
Introduction to turbine meters
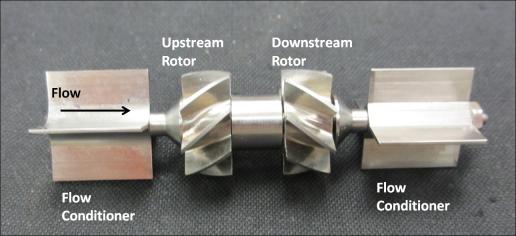
Turbine meters can consist of a single rotor or dual rotors. The frequency at which the blades turn represents a given flow because each blade sweeps out a fixed volume of fluid. Shown is a dual rotor meter with its casing removed and a single rotor meter with casing and a magnetic pick-off to record the rotor's frequency.
The standard for calibrating turbine meters
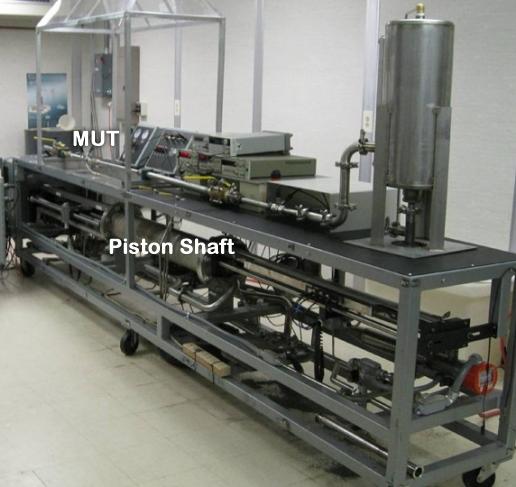
Turbine meters are calibrated using NIST's volumetric based, 20−L piston prover with a 1.2 centistoke (20 °C) PG+W mixture. The prover has a 95 % confidence level uncertainty of 0.074 %. In the figure, MUT stands for "meter under test."
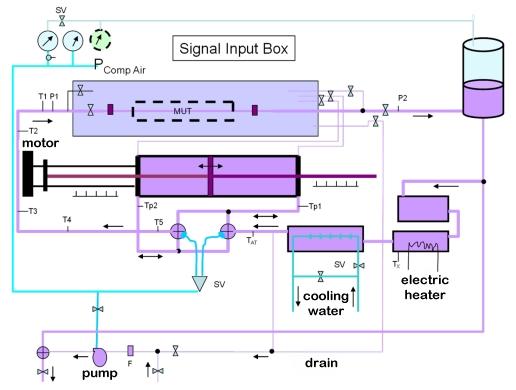
The following figure is a schematic of the 20−L piston prover. The motor−driven piston works like a syringe pump. It sweeps a known volume during known period of time through the cylinder generating a known flow through the meter. The frequency measured from the meter during the known volumetric flow gives the meter specific factor.
Presentation of data
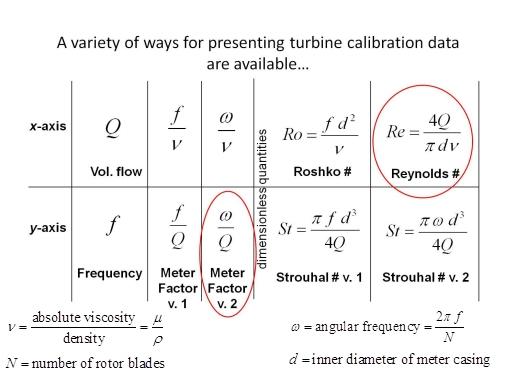
For a given meter, the geometry and fluid properties do not change during a calibration. Therefore, dimensionless quantities: Strouhal (St) and Reynolds Number (Re) or Roshko (Ro) numbers are used for the y and x-axis respectively (see table below). This approach for turbine meter calibration curves results in the collapsing of the multiple kinematic viscosity calibration curves in the viscosity independent range of the meter. Therefore differences in fluid properties between the fluid(s) being metered and the fluid used for calibration do not effect how the calibration curve is used to determine flow.
The difference in the curves in the following figures demonstrates the great advantage that Re provides for calibration curves, compared to Q. The top figure demonstrates the ranges of Re that define the laminar, transition, turbulent, bearing dependent and viscosity independent ranges of the curves. The Re value at which these ranges occur are meter specific. When referring to a turbine meter's calibration curve, it is common to hear the term "universal viscosity curve (UVC)". However, we have chosen not to use this term because it does not hold true for all ranges of the curve. Therefore, we use the term "viscosity independent range" that covers the part of the curve that is viscosity independent and the term "bearing dependent range" to define the portion of the curve that is not viscosity independent due to drags in the bearings that are highly influenced by the kinematic viscosity of the fluid being metered.
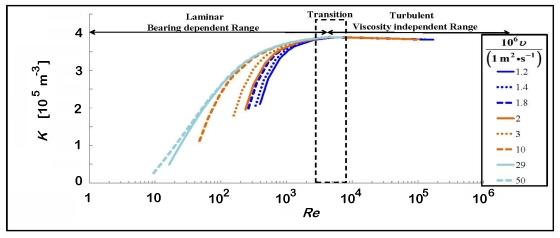
The plot above shows the meter factor (K = ω/Q) on the y-axis from 0 to 4×10⁵ m-3, as a function of Reynolds number (Re) on the x-axis from 1 to 1×10⁶, for several values of kinematic viscosity (ν) between 1.2×10⁻⁶ m2/s and 50×10-6 m2/s. The data collapse to a single curve for Re greater than 2000.
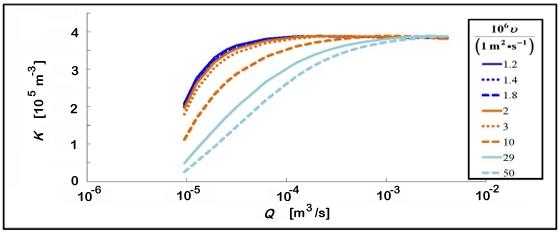
The plot above shows the meter factor (K = ω/Q) on the y-axis from 0 to 4×10⁵ m-3, as a function of volume flow rate (Q) on the x-axis from 1×10⁻⁶ to 1×10⁻² m3/s, for several values of kinematic viscosity (ν) between 1.2×10⁻⁶ m2/s and 50×10-6 m2/s. The data do not collapse when plotted this way.
Contacts
-
(301) 975-4586