
Official websites use .gov
A .gov website belongs to an official government organization in the United States.
Secure .gov websites use HTTPS
A lock (
) or https:// means you’ve safely connected to the .gov website. Share sensitive information only on official, secure websites.
Long-wavelength acoustic flowmeter
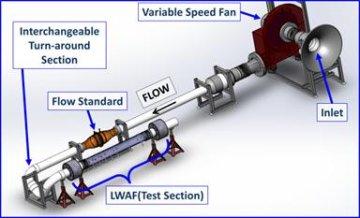
Figure 1. 1:100 scale (10 cm OD pipe) LWAF facility. The fan forces air through a calibrated flow standard (0.2 % uncertainty with a 95 % confidence level), then through a swirl-generating turn-around section, and finally through the LWAF.
Conventional gas flow measurements conducted in large ducts (such as the smoke stack of a coal-burning power plant) have uncertainties of 5 % to 10 %. Consequently, the quantity of pollutants (sulfur dioxide, mercury, nitrogen oxides, and carbon dioxide) emitted by such ducts have equally large uncertainties. As part of NIST's Greenhouse Gas Measurements Program, we are testing long-wavelength acoustic flow meters (LWAFs) to reduce this uncertainty. LWAFs measure the average volume flow of flue gases in smoke stacks. The measured volume flow can be combined with measurements of the flue gas's pressure, temperature, and composition to determine the mass of pollutants emitted by the stack.
To test LWAFs, we constructed the calibrated, 1:100 scale model, test facility shown in Fig. 1. The model LWAF determined the speed of sound in ambient air with a standard uncertainty of 0.05 %. Within this uncertainty, the speed of sound agrees with the value calculated from NIST's REFPROP database.
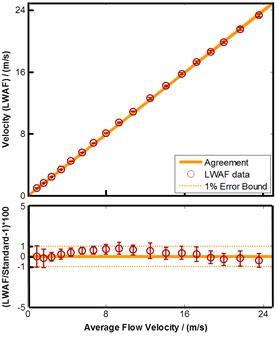
The same LWAF determined the average flow velocity. It agreed, within ±1 %, with the velocity determined from a NIST-calibrated flow standard upstream from the LWAF. This good agreement was maintained for flows up to 24 m/s, even after a swirl-inducing turn-around section was inserted between the flow standard and the LWAF. (See Fig. 3.) Similar uncertainties were obtained with highly distorted flows generated by placing obstructions upstream of the LWAF.
To verify the scalability of the method, we will test LWAFs in NIST's 1:10 scale smoke stack simulator.
Contacts
-
(301) 975-2468