
Official websites use .gov
A .gov website belongs to an official government organization in the United States.
Secure .gov websites use HTTPS
A lock (
) or https:// means you’ve safely connected to the .gov website. Share sensitive information only on official, secure websites.
Validation of PG+W
NIST and other calibration laboratories have validated that flow measurements made in a 5 % propylene glycol + water (PG+W) mixture are within the uncertainty of measurements made using Stoddard solvent over the usable range of the turbine meter. [3]
NIST has validated that flow measurements made in PG+W mixtures ranging from 5 % to 68 % PG are within the uncertainty of measurements made using Stoddard solvent over the usable range of the turbine meter. [4] The highest kinematic viscosity PG+W mixture that fell in the viscosity independent range of the calibration curve was determined by the flow capability of the NIST 20−L standard. This is because if the kinematic viscosity is increased, the tested flow must increase proportionally to obtain the same Re value. The diameter of the meter used to compare PG+W mixtures to Stoddard solvent shown in the following figure has a 2.5 cm diameter. If we used a larger diameter meter, the higher the kinematic viscosity of the PG+W mixture can be and still fall within the viscosity independent range of the calibration curve.
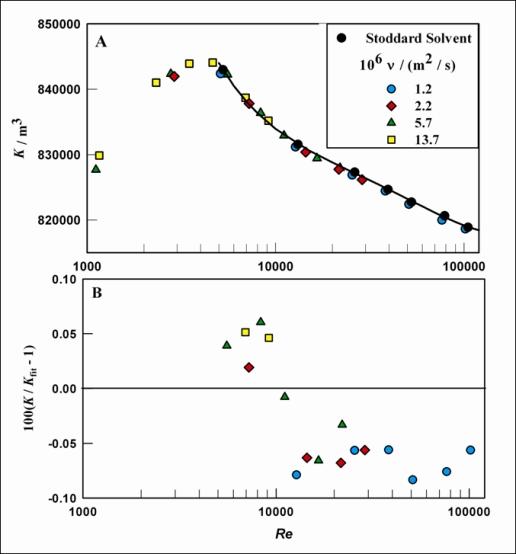
The top plot shows the meter factor (K = ω/Q) from 8.2×10⁵ to 8.5×10⁵ on the y-axis, as a function of Reynolds number (Re) from 103 to 105 on the x-axis for Stoddard Solvent and four mixtures of propylene glycol and water. The mixtures of propylene glycol and water have kinematic viscosities ranging from 1.2×10⁻⁶ m2/s and 13.7×10⁻⁶ m2/s. The measurements using the four propylene glycol and water mixtures differ by less than 0.1% from the measurements using Stoddard solvent, as shown by the deviations in the bottom plot.
[3] J. Wright, A. Johnson, G. Kline, C. Crowley, J. Pope, V. Bean, et al., A Comparison of 12 US Liquid Hydrocarbon Flow Standards and the Transition to Safer Calibration Liquids, Cal Lab Magazine: The International Journal of Metrology, vol. 19-2, pages 30 – 38 (2012).
[4] J.G. Pope, J.D. Wright, A.N. Johnson, M.R. Moldover, Extended Lee Model for the Turbine Meter and Calibrations with Surrogate Fluids, Flow Measurement and Instrumentation, vol 24, pages 71 – 82 (2012).
Contacts
-
(301) 975-4586