
Official websites use .gov
A .gov website belongs to an official government organization in the United States.
Secure .gov websites use HTTPS
A lock (
) or https:// means you’ve safely connected to the .gov website. Share sensitive information only on official, secure websites.
NRC Electrical Cabinet Experiments
Research Overview
Electrical switchgear enclosures housing equipment such as circuit breakers and motor controls are a common source of fire in industrial settings, and the heat release rate (HRR) and damage caused by these fires are important considerations in facility risk assessments. This experimental test series includes measurements of the HRR of circuit breakers within electrical enclosures as well as the internal temperature of electrical cables and other equipment outside of the enclosure exposed to the heat of fires within. Previous experiments have been conducted to determine HRR probability distributions for electrical enclosure fires. Analysis was then conducted to refine these results to consider specific electrical enclosure characteristics (e.g., classifying electrical enclosures in terms of function, size, contents/fuel loading, and ventilation). To date, there are few measurements1 of the HRR of circuit breaker fires in electrical enclosures, which have been observed to grow and continue burning for tens of minutes after high energy arc fault (HEAF) events. Thus, the experiments described here seek to quantify the peak HRR, time to peak HRR, and duration of circuit breaker fires in steel electrical enclosures. The second focus of these experiments is designed to quantify the thermal exposure of electrical cables that typically are installed in trays above an enclosure.
| Experiment Name | Plot of Heat Release Rate | Ignition Photo | Date/Time Sort descending | Specimen | Fuel Type | Test Duration (min) | Total Heat Released (MJ) | Peak HRR (kW) |
|---|---|---|---|---|---|---|---|---|
| NGQC_6m_12Kgs | 
|

|
Box Burner | Natural Gas | 29.08
|
468
|
642
|
|
| Test_01 | 
|

|
Box Burner | Natural Gas | 27.90
|
363
|
543
|
|
| Test_02 | 
|

|
Box Burner | Natural Gas | 21.83
|
367
|
422
|
|
| Test_03 | 
|

|
Box Burner | Natural Gas | 19.73
|
154.6
|
171.0
|
|
| Test_04 | 
|

|
Box Burner | Natural Gas | 15.47
|
71.7
|
114.3
|
|
| Test_05 | 
|

|
Box Burner | Natural Gas | 17.23
|
82.2
|
112.8
|
|
| LineBurnerCal | 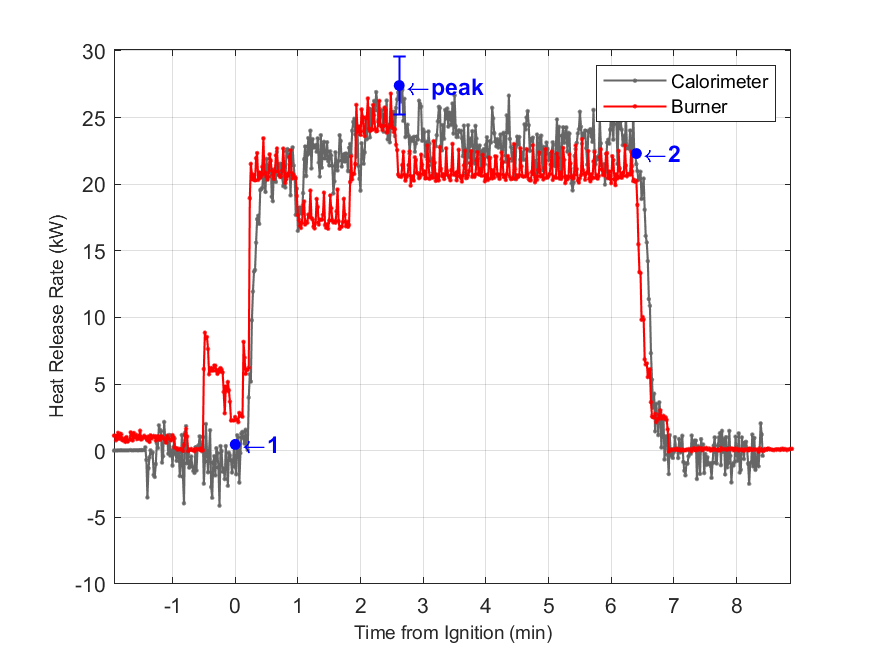
|

|
Line Burner | Natural Gas | 6.40
|
8.41
|
27.4
|
|
| PlasticAssortIgnition | 
|

|
Plastic assortment | Plastics, Natural Gas | 34.87
|
260
|
477
|
|
| Test_06 | 
|

|
Plastic assortment | Plastics, Natural Gas | 49.62
|
175
|
95.4
|
|
| Test_07 | 
|

|
Plastic assortment | Plastics, Natural Gas | 33.75
|
200
|
280
|
|
| Test_08 | 
|

|
Box Burner | Natural Gas | 15.10
|
162.1
|
244
|
|
| Test_09 | 
|

|
Gravel Burner | Natural Gas | 15.02
|
31.3
|
50.5
|
|
| Test_10 | 
|

|
Electrical Cables | PVC, Natural Gas | 26.15
|
36.5
|
44.7
|
|
| Test_11 | 
|

|
Electrical Cables | PVC, Natural Gas | 59.78
|
60.5
|
30.7
|
|
| Test_12 | 
|

|
Box Burner | Natural Gas | 18.57
|
417
|
641
|
|
| Test_13 | 
|

|
Box Burner | Natural Gas | 12.68
|
142.6
|
275
|
|
| Test_14 | 
|

|
Box Burner | Polystyrene | 37.57
|
194
|
186
|
|
| Test_15 | 
|

|
Box Burner | Natural Gas | 10.07
|
33.3
|
72.2
|
|
| Test_16 | 
|

|
Box Burner | Natural Gas | 11.70
|
55.6
|
105.0
|
|
| Test_17 | 
|

|
Box Burner | Natural Gas | 12.27
|
65.5
|
138.2
|
|
| Test_18 | 
|

|
Plastic assortment | Plastics, Natural Gas | 44.05
|
131.1
|
95.3
|
|
| Test_19 | 
|

|
Gravel Burner | Natural Gas | 21.48
|
123.7
|
170.9
|
|
| Test_20 | 
|

|
Electrical Cables | PVC, Natural Gas | 39.67
|
126.9
|
127.2
|
|
| Test_21 | 
|

|
Electrical Cables | PVC, Natural Gas | 55.82
|
174
|
96.5
|
|
| Test_22 | 
|

|
Box Burner | Natural Gas | 11.67
|
36.2
|
70.9
|
|
| Test_23 | 
|

|
Box Burner | Natural Gas | 11.35
|
31.7
|
69.1
|
|
| Test_24 | 
|

|
Box Burner | Natural Gas | 11.77
|
74.4
|
188
|
|
| Test_25 | 
|

|
Plastic assortment | Plastics, Natural Gas | 42.03
|
258
|
185
|
|
| Test_26 | 
|

|
Box Burner | Natural Gas | 12.58
|
61.5
|
127.3
|
|
| Test_27 | 
|

|
Box Burner | Natural Gas | 11.60
|
65.3
|
133.8
|
|
| Test_28 | 
|

|
Plastic assortment | Plastics, Natural Gas | 54.75
|
155
|
88.3
|
|
| Test_29 | 
|

|
Box Burner | Natural Gas | 15.70
|
141.0
|
254
|
|
| Test_30 | 
|

|
Box Burner | Natural Gas | 14.43
|
142.9
|
282
|
|
| Test_31 | 
|

|
Box Burner | Natural Gas | 19.23
|
285
|
419
|
|
| Test_32 | 
|

|
Plastic assortment, Electical Cables | Plastics, Natural Gas | 64.90
|
424
|
562
|
|
| NGQC_6m_12Kgs | 
|

|
Box Burner | Natural Gas | 31.20
|
555
|
618
|
|
| Test_33 | 
|

|
Box Burner | Natural Gas | 78.58
|
460
|
349
|
|
| Test_34 | 
|

|
Box Burner | Natural Gas | 57.60
|
235
|
172
|
|
| Test_35 | 
|

|
Box Burner | Natural Gas | 54.02
|
251
|
230
|
|
| Test_36 | 
|

|
Box Burner | Natural Gas | 4.55
|
14.6
|
108.6
|
|
| Test_37 | 
|

|
Box Burner | Natural Gas | 6.32
|
16.5
|
83.8
|
|
| Test_38 | 
|

|
Box Burner | Natural Gas | 30.48
|
81.3
|
56.5
|
|
| Test_39 | 
|

|
Box Burner | Natural Gas | 3.85
|
9.04
|
73.4
|
|
| Test_40 | 
|

|
Box Burner | Natural Gas | 84.78
|
425
|
134.3
|
|
| Test_41 | 
|

|
Box Burner | Natural Gas | 75.55
|
661
|
219
|
|
| Test_42 | 
|

|
Box Burner | Natural Gas | 17.68
|
116.0
|
215
|
|
| Test_43 | 
|

|
Box Burner | Natural Gas | 32.40
|
343
|
332
|
|
| Test_44 | 
|

|
Box Burner | Natural Gas | 32.17
|
325
|
||
| Test_45 | 
|

|
Box Burner | Natural Gas | 60.32
|
157
|
56.1
|
|
| Test_46 | 
|

|
Box Burner | Natural Gas | 19.12
|
50.4
|
110.0
|
|
| Test_47 | 
|

|
Box Burner | Natural Gas | 9.18
|
24.3
|
90.2
|
|
| Test_48 | 
|

|
Box Burner | Natural Gas | 5.82
|
11.60
|
70.7
|
|
| Test_49 | 
|

|
Box Burner | Natural Gas | 39.98
|
366
|
219
|
|
| Test_50 | 
|

|
Box Burner | Natural Gas | 28.33
|
411
|
503
|
|
| Test_51 | 
|

|
Box Burner | Natural Gas | 21.00
|
176
|
209
|
|
| Test_52 | 
|

|
Box Burner | Natural Gas | 20.20
|
131.7
|
214
|
|
| Test_53 | 
|

|
Box Burner | Natural Gas | 21.42
|
142.7
|
284
|
|
| Test_54 | 
|

|
Box Burner | Natural Gas | 24.15
|
173
|
199
|
|
| Test_55 | 
|

|
Box Burner | Natural Gas | 21.25
|
147.3
|
227
|
|
| Test_56 | 
|

|
Box Burner | Natural Gas | 24.20
|
173
|
196
|
|
| Test_57 | 
|

|
Box Burner | Natural Gas | 46.55
|
464
|
283
|
|
| Test_58 | 
|

|
Box Burner | Natural Gas | 37.93
|
357
|
283
|
|
| Test_59 | 
|

|
Box Burner | Natural Gas | 35.92
|
308
|
231
|
|
| Test_60 | 
|

|
Box Burner | Natural Gas | 38.53
|
364
|
316
|
|
| Test_61 | 
|

|
Box Burner | Natural Gas | 15.80
|
103.9
|
251
|
|
| Test_62 | 
|

|
Box Burner | Natural Gas | 11.00
|
39.7
|
202
|
|
| Test_63 | 
|

|
Box Burner | Natural Gas | 44.30
|
490
|
371
|
|
| Test_64 | 
|

|
Box Burner | Natural Gas | 21.35
|
176
|
362
|
Bryant, R. and Bundy, M. The NIST 20 MW Calorimetry Measurement System for Large-Fire Research, Technical Note (NIST TN) 2077, 2019
https://doi.org/10.6028/NIST.TN.2077
NIST Fire Calorimetry Database (FCD)
https://doi.org/10.18434/mds2-2314