BridgeLCC

Life-cycle costing software for preliminary bridge design
BridgeLCC is user-friendly life-cycle costing software developed by the National Institute of Standards and Technology (NIST) to help bridge engineers assess the cost effectiveness of new, alternative construction materials. The software uses a life-cycle costing methodology based on both ASTM standard E 917 and a cost classification developed at NIST.
BridgeLCC is specifically tailored for comparing new and conventional bridge materials --- for example, high-performance concrete versus conventional concrete --- but works equally well when analyzing alternative conventional materials. Also, it can be used to analyze pavements, piers, and other civil infrastructure.
Uses
Tools for Designing Cost-Effective Building Systems
The Office of Applied Economics develops economic methods and software to aid industry in evaluating the cost effectiveness of new-technology construction materials, "green" building materials, building energy systems, and other construction/building processes. BridgeLCC 2.0 supports this effort by helping engineers to evaluate bridge-related design decisions, including
- what bridge designs are life-cycle cost-effective;
- whether to repair an existing bridge or replace it;
- whether to use a new construction material or process in a bridge design; and
- what are acceptable levels of cost risks associated with earthquakes, river flooding, or other disasters.

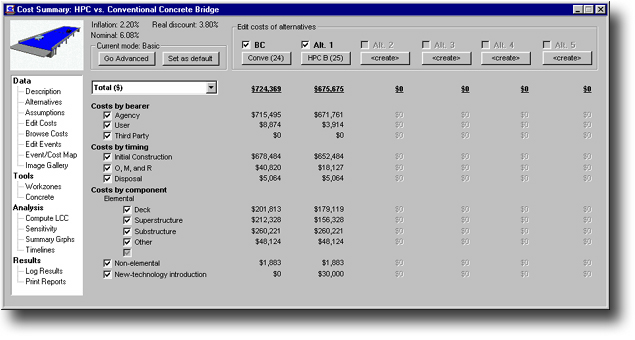
Figure 1. BridgeLCC Cost Summary Window
BridgeLCC 2.0 uses an economic methodology based on the ASTM Standard Practice for measuring the life-cycle costs of buildings and building systems (E 917). The software includes a cost classification scheme that helps insure that all costs are accounted for and are well organized so that useful comparisons can be made quickly between project alternatives. Analyses are carried out in discrete steps, which are now listed on the left side of the BridgeLCC Cost Summary Window (Figure 1).
Basic Mode: Deterministic Analyses
So as to accommodate two types of analysis --- relatively basic estimations of life-cycle cost and comprehensive life-cycle cost that include uncertainty and risk assessments --- BridgeLCC 2.0 can operate in two alternate modes: (1) a Basic Mode where the amounts and timings of costs are best-guess values without any uncertainty, and (2) an Advanced Modewhere uncertainty in amounts and timings of costs can be taken into consideration. The analyst can switch back and forth between the two modes without any loss of data.
Sensitivity Analysis
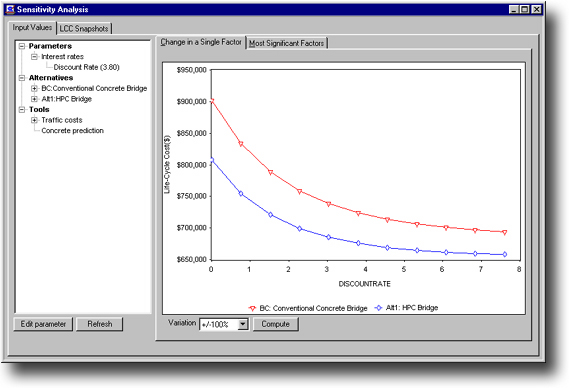
Within the Basic Mode, after inputting and computing the life-cycle costs of the alternative designs, materials, or processes, the analyst can use the Sensitivity Analysis window (Figure 2) to see what effect changes in individual parameters and costs can have on the overall life-cycle cost effectiveness of particular alternatives. Likewise, the analyst can have BridgeLCC compute and compare the relative sensitivity of all parameters and costs and then view them in one table.

Figure 2. Sensitivity Analysis Window
Advanced Mode: Uncertainty and Risk
In the Advanced Mode, the analyst can assign one of four probability distributions (uniform, normal, triangular, lognormal) to quantity, unit cost, and timing of individual costs. The analyst then runs Monte Carlo simulations to see how these uncertainties in individual costs create uncertainty in the overall life-cycle cost effectiveness of each alternative (Figure 3).

Figure 3. Analysis of Results Window
Supporting Tools
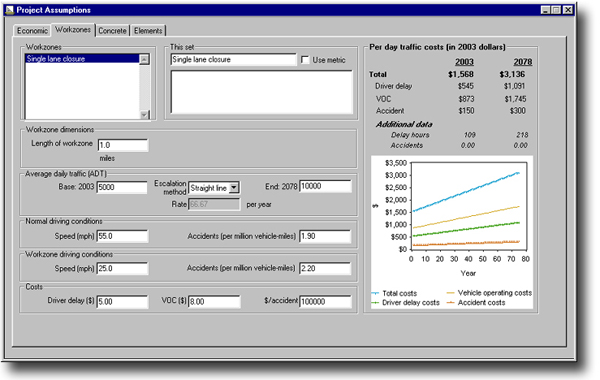
BridgeLCC includes several important tools that support comprehensive life-cycle cost analysis of bridges. The Workzones window (Figure 4) allows the user to estimate the per-day cost of road construction and repair to drivers on and under a bridge, in terms of driver delay costs, vehicle operating costs, and accident costs. These user costs are then applied to alternatives to see how these costs affect the overall life-cycle cost effectiveness of each alternative.

Figure 4. Workzones Window
BridgeLCC 2.0 also includes an expanded Concrete Service Life Prediction Tool for estimating bridge damage caused by exposure to road salts.
Improvements over BridgeLCC 1.0
BridgeLCC 2.0 offers significant features compared with BridgeLCC 1.0, including:
- analyzing up to 6 alternatives at a time;
- creating life-cycle 'events' that affect many agency, user, or third-party costs;
- creating and using multiple workzones (with driver delay, vehicle-operating costs, and accident costs);
- improved sensitivity analysis of interest rates, life-cycle events, and costs;
- improved Monte Carlo simulation, in which most parameters can be modeled with probability distributions;
- unified reporting designed for direct submission to stakeholders and clients;
- online, context-sensitive help;
- select non-U.S. currencies (British, Japanese, Euro, General).
Interest Rates
The following inflation and discount rates are recommended for use in BridgeLCC.
| Inflation Rate | |||||
| Length of Study Period | |||||
| Base year | 3-year | 5-year | 7-year | 10-year | 30-year |
| 2003 and beyond | 1.5% | 1.7% | 1.7% | 1.7% | 1.8% |
| Real Discount Rate | |||||
| Length of Study Period | |||||
| Base year | 3-year | 5-year | 7-year | 10-year | 30-year |
| 2003 and beyond | 1.6% | 1.9% | 2.2% | 2.5% | 3.2% |
Source:
Office of Management and Budget, Guidelines and Discount Rates for Benefit-Cost Analysis of Federal Programs, Appendix C, OMB Circular A-94, Washington, D.C., January, 2003.

