 |
|
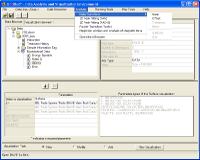
The main application window of DAVE 2. |
| |
 |
|
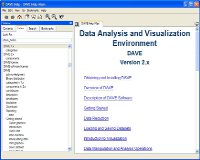
The integrated documentation interface in DAVE 2. |
| |
 |
|
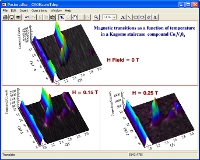
Creating multiple surface plots in a single window using the Window Layout feature to create multiple views. |
| |
 |
|
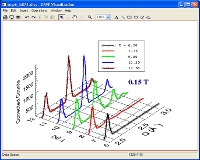
A 2-dimensional line plot in DAVE 2. Note grid in the T-K plane. |
| |
 |
|
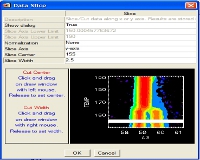
The slice operation interface that enables the user to generate a 1D slice out of a 2D data along the x- or y-axis. |
| |
 |
|
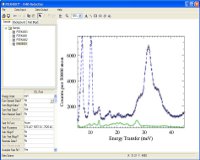
FANS Data Reduction main window. |
| |
 |
|
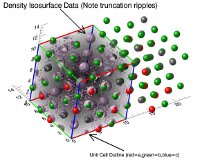
Visualization of the Fourier density map (F observed) and corresponding atomic positions for a simple spinel structure measured by single crystal x-ray diffraction using the 3DenPro module. |
| |
 |
|
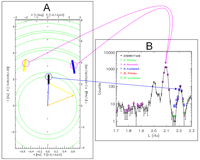
Visualization of the scattering plane of a TAS measurement highlighting the sources of spurious features in the measured scan using the TAS Scan Mapper module. |
| |
 |
|
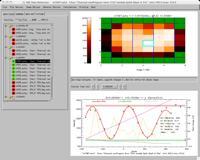
NSE Data Reduction main window. |
| |
 |
|
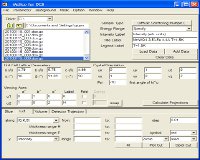
Main window of the Mslice module. Mslice is used to reduce, visualize and analyze time-of-flight and other multi-detector instruments. It is particularly geared towards handling data from single crystal samples. |
| |
 |
|
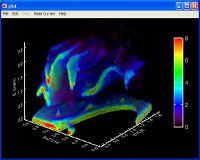
A volume visualization created using Mslice. Mslice can handle any arbitrary multi-dimensional data defined as intensity as a function of several independent variables. |
| |
 |
|
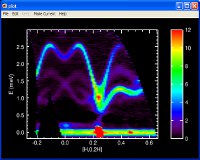
Scattering within a plane extracted using Mslice. |
| |
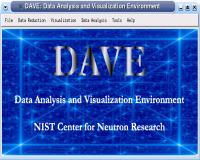 |
|
The main DAVE application interface. |
| |
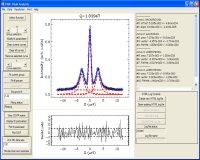 |
|
Using the data analysis module, PAN, to perform
least squares fit to simulated HFBS data. |
| |
| |
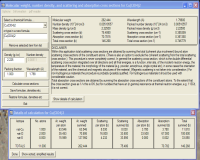 |
|
Using the Neutron cross section Calculations tool to
determine the neutron cross section of a compound.
Neutron cross section table (scattering + absorption)
for all elements are also included. |
| |
| |
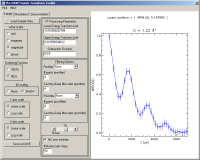 |
|
The Fourier Transform Toolkit (CVS Build only).
The intermediate scattering function for tunneling
in methyl iodide. The data were taken using the NG2
backscattering spectrometer. Two inelastic peaks in S(Q,E)
manifest themselves as an oscillation in the time-domain.
The effects of instrumental resolution are evident. |
| |
 |
|
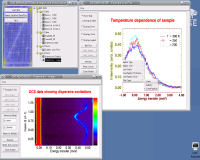
View of the main Data Browser interface showing
tree widget containers for data (1D and 2D) and plots (1D and 2D).
Also shown is an example of an image view of a 2D dataset
as well as a line plot of multiple 1D datasets. |
| |
 |
|
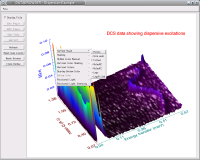
Surface view of a 2D dataset with the Data Browser.
Almost every attribute of the visualization can be customized.
The location of the excitations can be determine by fitting the data
using the PAN least-squares fitting module within DAVE. |
| |
 |
|
Snapshot of session analyzing NDMAP single
crystal data using DCS Mslice. |
| |
 |
|
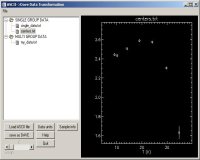
Reading ASCII data (from values extracted from a
fit in PAN fitting module) using the ASCII data reader. |
| |
 |
|
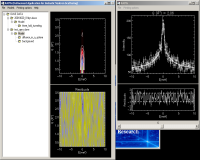
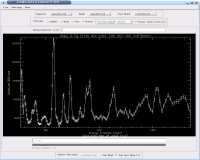
A quasielastic neutron scattering data set analyzed
using a diffusion within a sphere model in the RAINS
application module. |
| |
 |
|
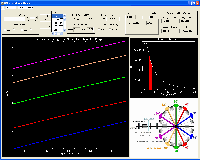
Performing data reduction with the FANS
data reduction module. |
| |
| |
 |
|
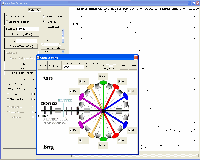
Planning for an experiment on MARS by checking the effects
of various instrument configuration parameters using the
MARS Tools Experiment Planner. |
| |
 |
|
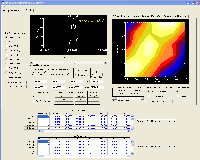
Performing data reduction with Reduce MARS Data module. |
| |
 |
|
Using the MARS analyser Banks Calibration module to
calibrate detectors on the MARS instrument. |
| |
If you reduced, analyzed or visualized your data using DAVE, please acknowledge its use by including the following reference:
[1] DAVE: A comprehensive software suite for the reduction, visualization, and analysis of low energy neutron spectroscopic data, R.T. Azuah, L.R. Kneller, Y. Qiu, P.L.W. Tregenna-Piggott, C.M. Brown, J.R.D. Copley, and R.M. Dimeo, J. Res. Natl. Inst. Stan. Technol. 114, 341 (2009).
This software was developed at the National Institute of Standards and Technology at the NIST Center for Neutron Research by employees of the Federal Government in the course of their official duties. Pursuant to title 17 section 105* of the United States Code this software is not subject to copyright protection and is in the public domain. The DAVE software package is an experimental neutron scattering data reduction, visualization, and analysis system. NIST assumes no responsibility whatsoever for its use, and makes no guarantees, expressed or implied, about its quality, reliability, or any other characteristic. The use of certain trade names or commercial products does not imply any endorsement of a particular product, nor does it imply that the named product is necessarily the best product for the stated purpose. We would appreciate acknowledgment if the software is used.
*Subject matter of copyright: United States Government works
Copyright protection under this title is not available for any work of the United States Government, but the United States Government is not precluded from receiving and holding copyrights transferred to it by assignment, bequest, or otherwise.
Acknowledgments
This work is based upon activities supported by the National Science Foundation under Agreement No. DMR-0944772 (previously DMR-0454672 for period 2005 to 2010).
The DAVE development team consists of Richard Azuah, John Copley, Rob Dimeo, Sungil Park, Seung-Hun Lee, Alan Munter, Larry Kneller, Yiming Qiu, Inma Peral, Craig Brown, Paul Kienzle and Philip Tregenna. Additional open source utilities written by David Fanning, Ronn Kling, Mark Piper, Michael D. Galloy, and Craig Markwardt have been incorporated into some of the DAVE programs as well.


