Blogrige
The Official Baldrige Blog

How would you visualize learning when considering the relationship between the Baldrige Excellence framework and its Criteria and Lean Six Sigma?
Eric Franks, an adjunct instructor at Tennessee Tech University and alumni Baldrige Examiner (he was also the manager of technology and quality assurance at Baldrige Award recipient PRO-TEC), teaches a class called “Quality and Productivity Systems” about Lean Six Sigma. Recently, while teaching the topic of "Implementing Six Sigma," he used the Baldrige slide "From Fighting Fires to Innovation: An Analogy for Learning" and discussed the challenges for small businesses.
To get at these challenges, he asked some of the following questions:
- Where is the organization along the cost of quality (COQ) curve? (This would show an organization's relative maturity.)
- What are the realistic project expectations and outcomes?
- What is the alignment of the project expectations to the vital few objectives?
- What are the available resources of time, talent, and treasure (since no one has unlimited resources)?
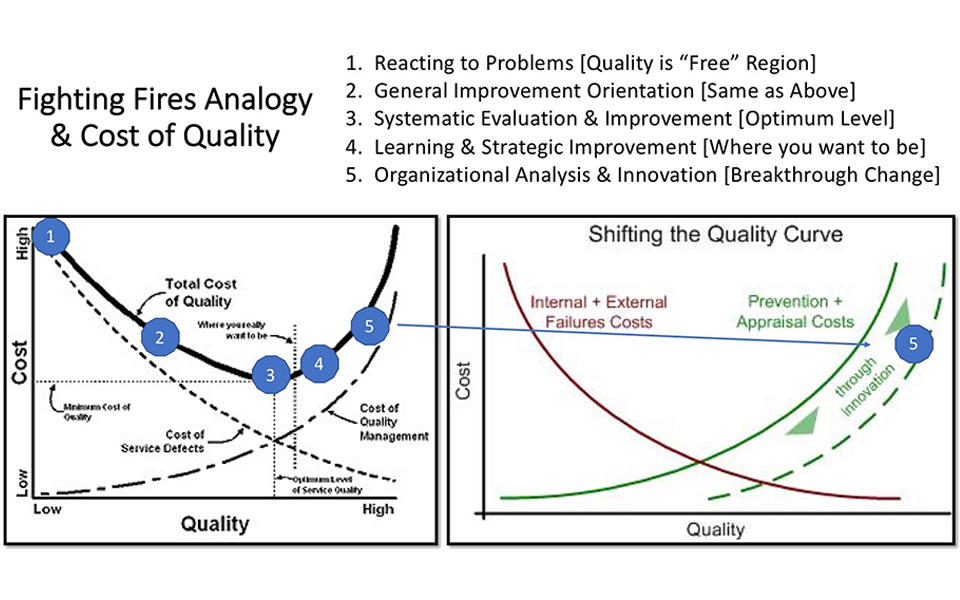
At the end of the slide presentation, Franks asked the students for questions. The students asked for help to better understand how the Baldrige graphic corresponded to Lean Six Sigma projects. After brief consideration, Franks said he went to the white board and sketched the COQ curve and marked the related five points in the diagram he created to capture the concept.

Franks adds a few notes to go with the diagram:
- In regards to circle 4, “where you really want to be," this position would be sector/industry dependent. The position might be very dependent on competitor quality and the organization’s investment in innovation.
- The diagram makes an assumption that circle 3 (optimal) may be represented by a Cpk of 1.0 (+/- 3 Sigma) in statistical control.
- For the automotive industry (shown in the diagram), a typical customer expectation of a steel supplier may be at least a Cpk of 1.33 (+/- 4 Sigma).
- In the case of commodity products/services, the COQ may be driven by just what the customer is willing to pay for and/or competitive position.
- The arrow pointing to the second graph's dashed green curve (a.k.a. the cost of "good" quality) shows a breakthrough improvement in quality for the same relative cost (total cost is not shown).
- Much like a reliability "bath tub" curve, moving toward ever-higher quality is a case of diminishing return (i.e., requiring breakthrough improvement).
This of course is just one expert's opinion. Other experts might have pause with calling #3 "optimal," suggesting there may be a more appropriate word. Another might suggest that #5 be lowered a little in the diagram, as the total cost of quality would hopefully go down.
How would you visualize learning in terms of Baldrige and Lean Six Sigma?
A Systems Approach to Improving Your Organization’s Performance

Baldrige Excellence Framework
The Baldrige Excellence Framework has empowered organizations to accomplish their missions, improve results, and become more competitive. It includes the Criteria for Performance Excellence, core values and concepts, and guidelines for evaluating your processes and results.
Purchase your copy today!
Available versions: Business/Nonprofit, Education, and Health Care


