
Official websites use .gov
A .gov website belongs to an official government organization in the United States.
Secure .gov websites use HTTPS
A lock (
) or https:// means you’ve safely connected to the .gov website. Share sensitive information only on official, secure websites.
How Do You Measure Greenhouse Gases?
They’re invisible and odorless yet all around us. They float in the air in tiny amounts yet have profound impacts on our world. The challenge of reducing their concentrations has given rise to global treaties, billions of dollars in government and corporate spending and impassioned political debates.
They’re greenhouse gases — a coterie of airborne molecules that trap light radiating from Earth’s surface, warming the planet and making extreme weather more likely and destructive. So serious is the global warming problem that in 1994, the nations of the world committed themselves to stabilize greenhouse gas concentrations “at a level that would prevent dangerous anthropogenic (human-induced) interference with the climate system.”
Yet 30 years later, the world is still struggling to rein in these troublesome gases.
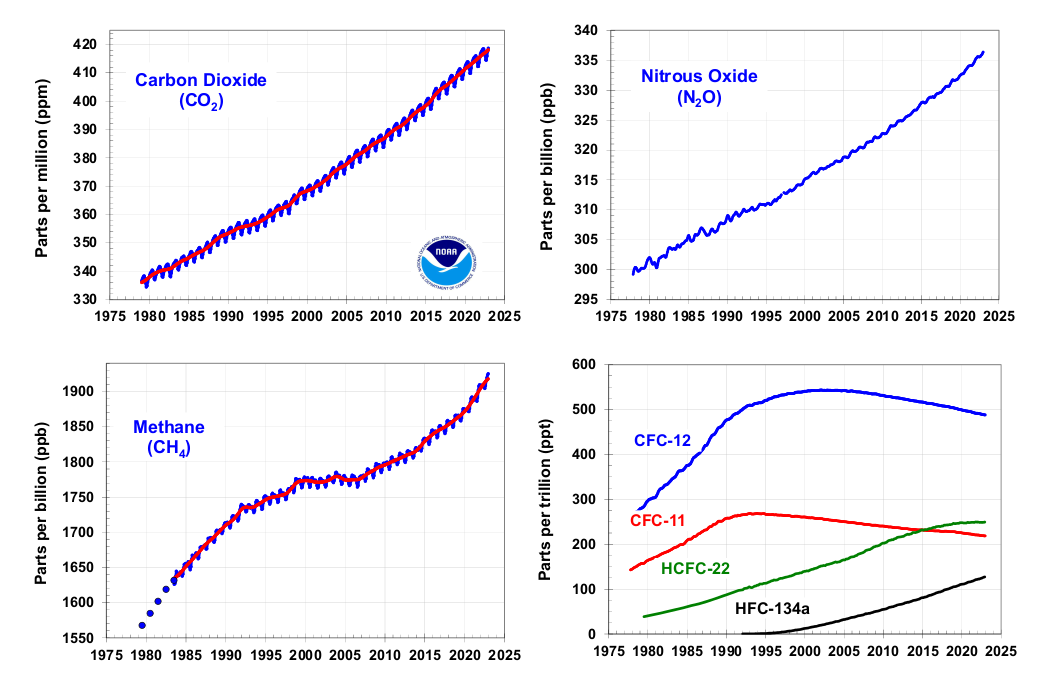
To know if actions taken to stabilize greenhouse gas levels are working, we must measure the concentrations of these gases in the atmosphere over time. That means accurately detecting them in tiny amounts: carbon dioxide in the hundreds of parts per million (or micromoles per mole), methane in thousands of parts per billion, nitrous oxide in the hundreds of parts per billion, and gases known as fluorinated hydrocarbons at even lower levels.
| Gas | Chemical symbol | Global warming potential (how much warming one molecule causes over 100 years, relative to a molecule of CO2) | Concentration in the atmosphere (2023 global average measured in micromoles per mole, or parts per million) |
|---|---|---|---|
| Carbon dioxide (CO2) | 
| 1 | 419
|
| Methane (CH4) | 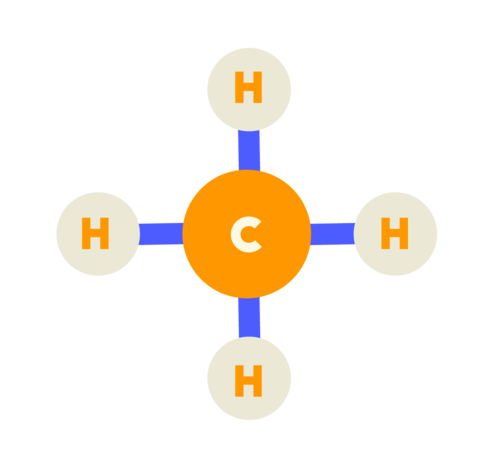
| 27 – 30 | 1.92 |
| Nitrous oxide (N2O) | 
| 273 | 0.337 |
| Fluorinated gases | Various | 1,000s – 10,000s | Varies (but less than 1 part per trillion for any individual gas) |
Source: Global warming potential data from EPA; greenhouse gas concentration data from NOAA
Fortuitously, the same feature that causes greenhouse gases to heat the planet can be used to detect and measure their concentrations.
A Unique ‘Fingerprint’
That feature is the fact that gas molecules absorb light. Indeed, all objects, from tiny molecules to massive stars and planets, absorb and radiate light.
But the colors — or light wavelengths — that different gases and objects radiate and absorb can vary dramatically. The Sun, with a broiling-hot surface temperature of around 5,600 degrees Celsius (10,000 degrees Fahrenheit), radiates most strongly at relatively short wavelengths of hundreds of nanometers — or billionths of a meter. These are colors of light we can see.
Even as sunlight warms the Earth, our planet remains much cooler than the Sun and radiates entirely in infrared light. Infrared light has wavelengths longer than 1 micrometer (millionths of a meter) that we can’t see — at least not without special goggles.
Greenhouse gas molecules absorb some of this infrared light, warm up and then transfer heat to other molecules in the atmosphere through collisions. The warmed atmosphere also radiates infrared light. Some of this radiation heads out to space, but some goes toward Earth, warming the planet’s surface further.
Overall, this warming is a good thing: Without any greenhouse effect, Earth’s surface would be frigid, with an average temperature of minus 18 degrees Celsius (zero degrees Fahrenheit) — and life as we know it would not exist!
But the greenhouse effect becomes too much of a good thing when we add a lot of heat-trapping molecules to the atmosphere. Most of these molecules are carbon dioxide, which is emitted when coal, oil and gas are burned for energy; some carbon dioxide also comes from burning forests and soil that is plowed or disturbed for agriculture. Methane is emitted mainly from livestock, oil and gas wells and pipelines, landfills and wetlands; nitrous oxide comes from farm fields and factories; and fluorinated gases leak from cooling equipment.
Each type of greenhouse gas molecule absorbs a unique set of light wavelengths, creating a sort of spectral fingerprint. Just as your fingerprint can identify you among the billions of people on Earth, the absorption spectra of molecules can be used to identify them, thanks to a set of powerful techniques known collectively as spectroscopy.
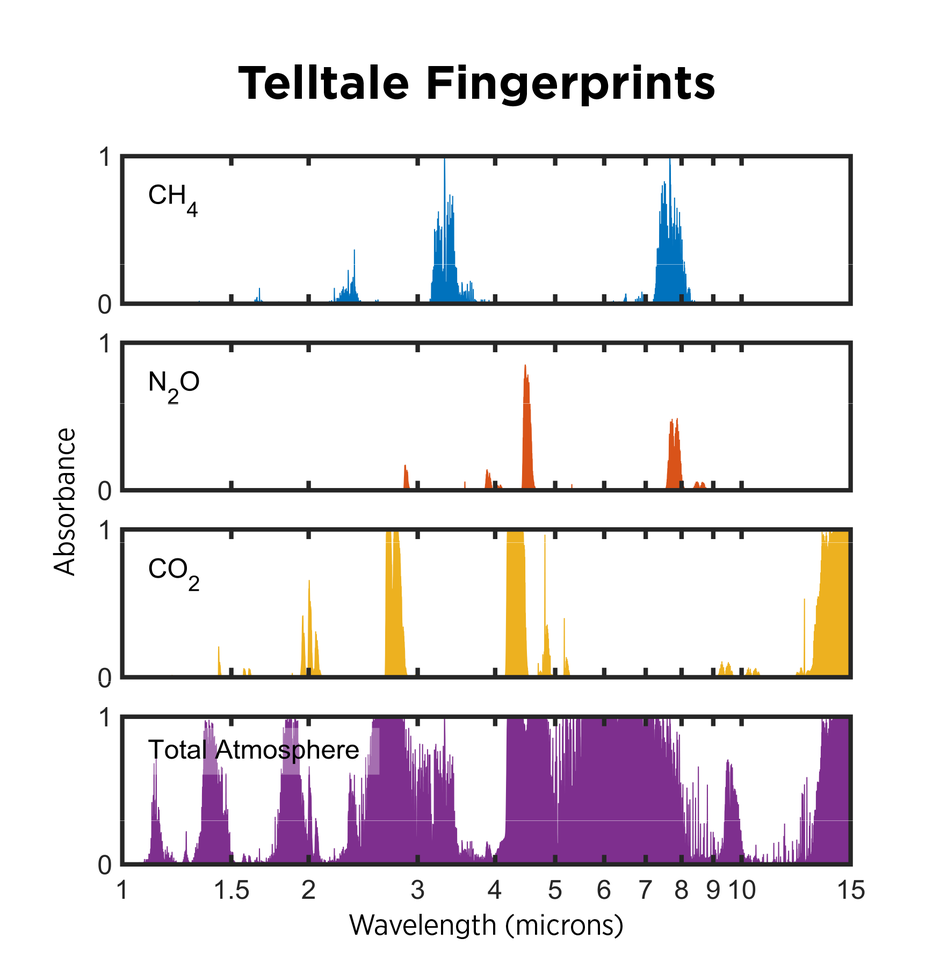
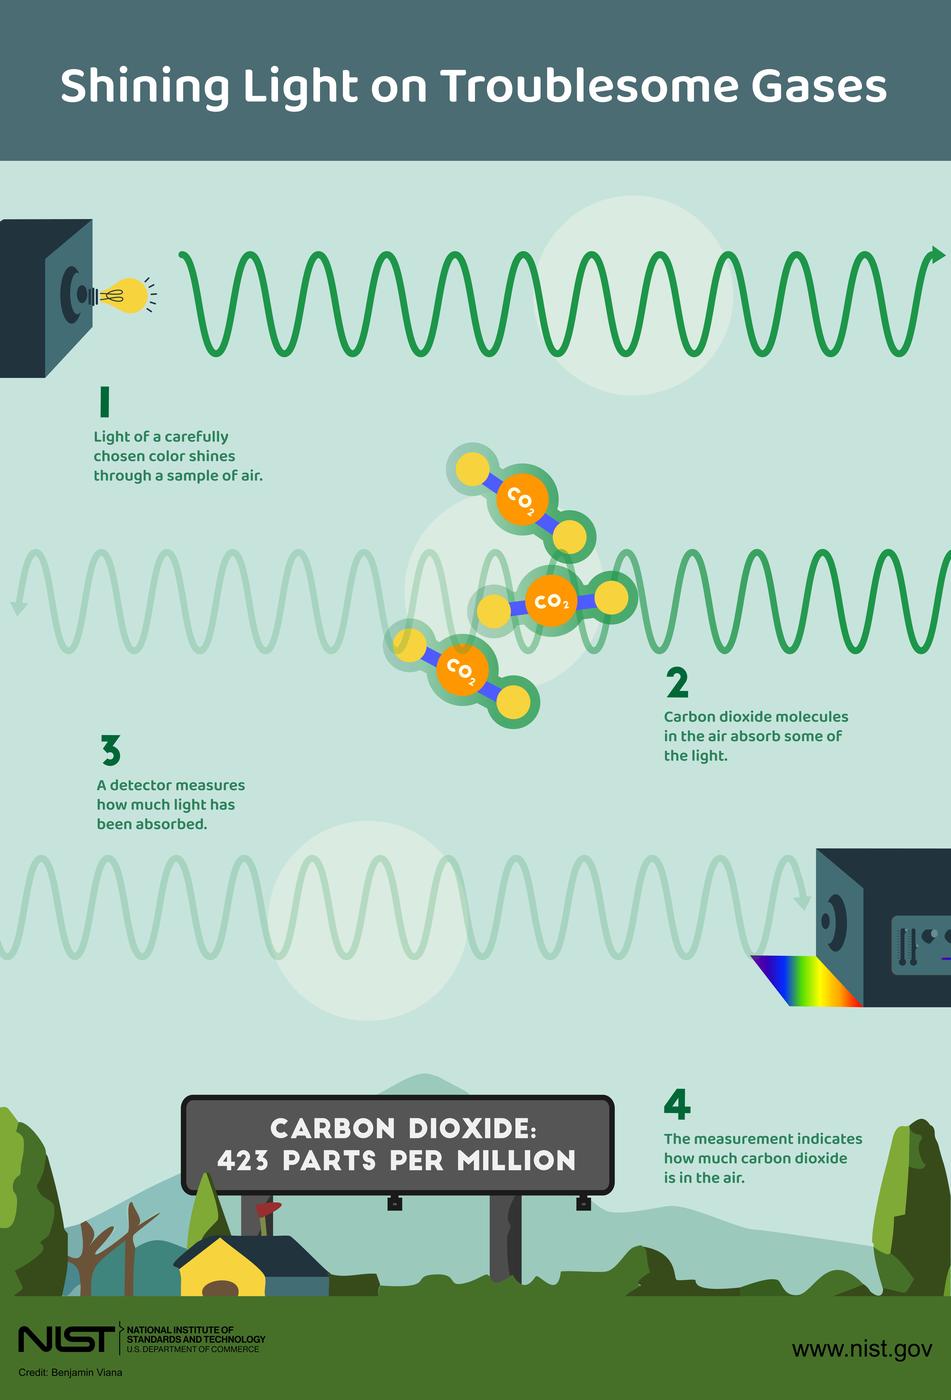
These techniques involve allowing infrared light to pass through air — essentially mimicking the planet’s radiation — then collecting the light with a detector. Because each gas absorbs light at specific wavelengths, scientists can use the amount of light detected at those wavelengths to determine how much of each gas is present.
Spectroscopy comes in many flavors and uses a variety of instruments. Which flavor a scientist chooses depends on their goals and how precise an estimate they need.
A Menu of Options for Measuring Greenhouse Gases
Use the links below to learn about four methods scientists use to measure greenhouse gases in the atmosphere.
A World-Changing Measurement Method
One of the best-established ways to measure greenhouse gas concentrations is called nondispersive infrared, or NDIR, spectroscopy.
An NDIR spectroscopy measurement starts by sucking air into a tube. An infrared lamp shines light into the tube at one end, and the light is measured at the other. In front of the detector, a filter removes most wavelengths outside a narrow range that the gas of interest absorbs. One common wavelength used to detect carbon dioxide is 4.26 microns, or millionths of a meter — roughly one-fifth the width of a thin human hair.
In a second tube, the same infrared light passes through a gas such as nitrogen that does not absorb any of the light. The difference between the amount of light detected in the two tubes indicates how much carbon dioxide (or other gas) is in the air sample.
To turn the detector reading into an accurate measurement, the instrument must be calibrated by measuring light that passes through purified air with a known concentration of the gas of interest.
NDIR spectroscopy has played a key role in one of history’s most important measurement campaigns. It started in 1958, when Charles David Keeling, a researcher with the Scripps Institution of Oceanography, took readings of atmospheric carbon dioxide first at the Scripps campus in San Diego and then at the Mauna Loa Observatory, near the summit of Mauna Loa in Hawai‘i.
On its first day of operation, the instrument measured an atmospheric greenhouse gas concentration of 313 parts per million. In other words, out of a million molecules of air, 313 were carbon dioxide.
Keeling improved his measurements over time by incorporating standardized calibration gases, as described above. His data series, which became known as the Keeling Curve, showed definitively that the amount of carbon dioxide in the air was increasing. It also showed that carbon dioxide fluctuates seasonally, with summertime lows caused by plants in the Northern Hemisphere “inhaling” the gas and growing leaves alternating with wintertime highs caused by leaves decomposing and “exhaling” carbon dioxide back to the atmosphere.
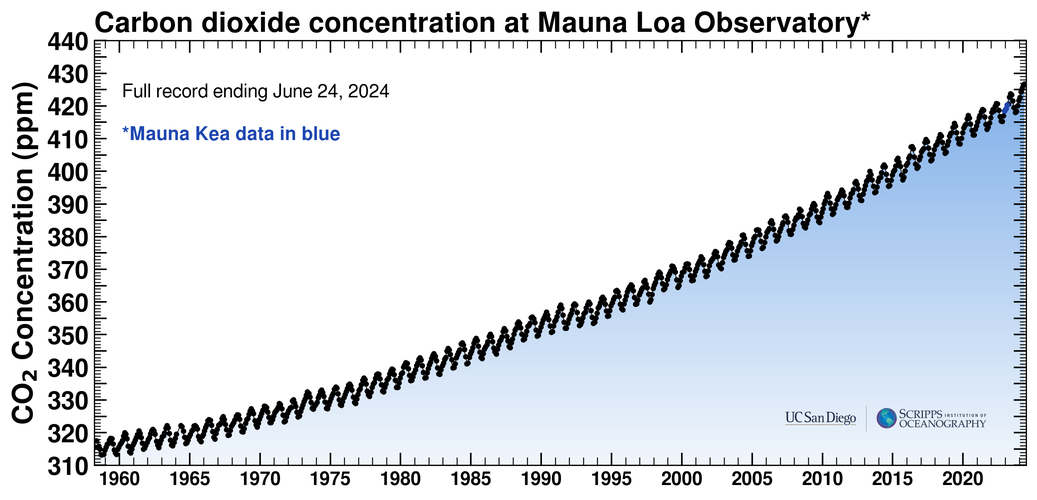
The Keeling Curve continues to this day. In May 2024, it reached an ominous new record: 426.89 parts per million, 36% higher than when it started.
The Scripps program has been joined by a larger program run by the National Oceanic and Atmospheric Administration (NOAA), which monitors greenhouse gas concentrations at Mauna Loa and, in collaboration with other nations, more than 50 other locations around the world. For most of its history, NOAA’s carbon dioxide measurements relied on the same NDIR technology Keeling used.
Striving for Higher Precision
A newer measurement technique called cavity ring-down spectroscopy, or CRDS, is one of the most precise ways scientists have developed to measure greenhouse gases. CRDS instruments pull an air sample into a small chamber whose ends comprise two or more mirrors that have been finely polished and designed to be extremely reflective. An infrared laser tuned to a color absorbed by the gas of interest shines into the chamber and is then turned off.
The laser light bounces back and forth thousands of times, traveling as far as the distance from Philadelphia to New York while confined inside a chamber just 75 centimeters long. That gives the light much more time to interact with the molecules in the chamber, amplifying the measurement sensitivity. (It’s also why the technique is sometimes called long-path spectroscopy.)
Key to the method is that at least one mirror is not completely reflective. Every time the laser light hits such a mirror, a tiny bit leaks out, and the intensity of the light remaining in the chamber decreases slightly — a process called “ring-down.” Over time, the intensity traces a well-known shape known as an exponential decay curve.
If a greenhouse gas such as carbon dioxide is in the chamber, it will absorb some of the infrared laser light, making the light intensity inside the chamber decline more quickly. By comparing how fast the intensity falls in a chamber containing a greenhouse gas to one with no absorbing gases, the instrument can produce a highly accurate estimate of the gas concentration.
For accuracy in the field, similar to NDIR, a commercial CRDS instrument requires a cylinder of standardized reference air for calibration — but it requires much less of the gas.
NIST scientists and collaborators have put CRDS sensors on towers to create monitoring networks in three metropolitan areas: Los Angeles, Indianapolis and the Washington, D.C.-Baltimore region. The measurements enabled the researchers to detect a drop in carbon dioxide emissions in LA and D.C.-Baltimore at the beginning of the COVID pandemic, and a several-year decline in methane emissions in the D.C.-Baltimore region, possibly as leaks in underground gas pipes were detected and fixed.
The sensitivity of CRDS also allows scientists to measure not just the total concentration of carbon dioxide in a sample, but the amounts of different variants of carbon. Naturally occurring carbon dioxide in the air includes a small amount of a radioactive type (or isotope) of carbon known as C-14. But fossil fuels that have been buried for millions of years have no C-14 left. By measuring the concentration of C-14-containing carbon dioxide in a sample, scientists can determine how much of the gas came from fossil fuels being burned.
And recognizing the advantages of cavity ring-down spectroscopy, both Scripps and NOAA have installed CRDS analyzers at the Mauna Loa Observatory, incorporating the method into their monitoring programs.
A View From Above
NDIR and CRDS are powerful methods, but these instruments measure greenhouse gases in just one location at a time. In recent years, a growing flotilla of airplanes and satellites has taken to the skies to peer down on Earth, measure greenhouse gases over large areas or even the entire globe and, using computer modeling and weather data, attempt to figure out where they are coming from and in what quantities. Some of these planes and satellites are operated by government agencies; others are run by nonprofits and companies.
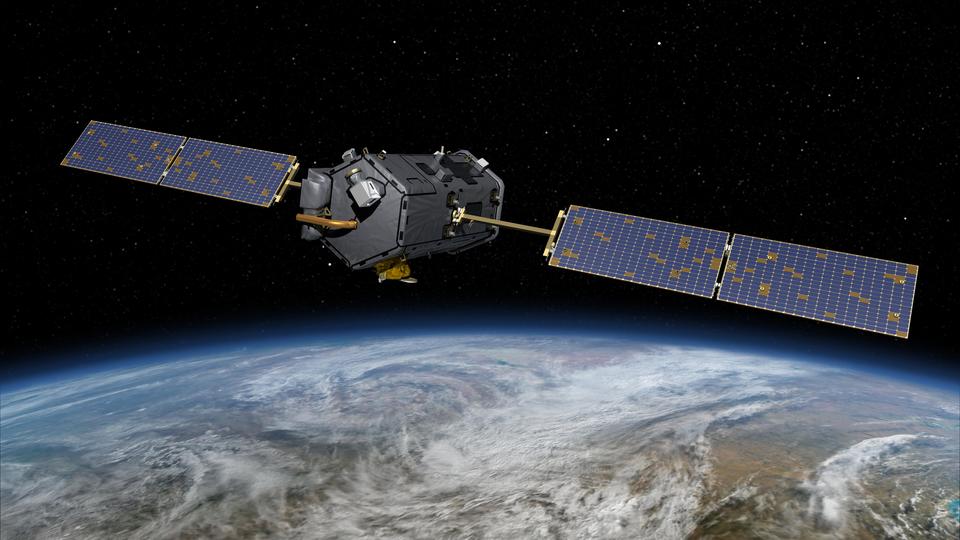
Many of these greenhouse gas-measuring satellites and airplanes use spectroscopy — but a very different flavor from NDIR and CRDS. Their light source is sunlight that reflects off Earth’s surface, travels through the atmosphere and arrives at a detector that could be up to hundreds of kilometers above the ground.
Satellites and airplanes measure greenhouse gases not just in one spot but in a column of air stretching from the ground to the height of the sensor. They excel at surveying large areas and spotting plumes of gases emitted by larger sources such as heavily leaking oil and gas fields — often called “super-emitters.”
Unlike NDIR and CRDS sensors, airborne sensors cannot be continuously calibrated to a standardized reference gas. They instead rely on reference spectra based on precise laboratory measurements, and they compare the amount of reflected light absorbed by a greenhouse gas such as carbon dioxide or methane to that absorbed by oxygen, whose atmospheric concentration is well known and very stable. Satellites’ infrared cameras are also calibrated to ones on the ground that point at the Sun and measure the infrared light coming in.
Recent studies have demonstrated how satellite- and airplane-based sensors can improve our understanding of methane sources. For example, aerial measurements have found that some oil and gas fields seem to be emitting surprisingly large amounts of methane. Methane can leak from well sites, processing facilities and pipes. And because it is a powerful greenhouse gas, undetected leaks can cause a lot of climate warming. Since gas is valuable, oil producers have an incentive to plug these leaks, helping both the climate and their bottom line.
Other recent studies using sensors aboard both airplanes and satellites have found that landfills in the U.S. may also be leaking more methane than previously thought. Methane is produced when organic materials such as food break down in landfills in the absence of oxygen. Since landfills exist around the country and the world, some of the detected methane molecules could have originated from a fruit peel or coffee grounds that you discarded!
Selected greenhouse gas datasets generated by airplane and satellite sensors are available at the recently launched U.S. Greenhouse Gas Center, a joint project of NIST, NASA, EPA and NOAA.
Combing for Gases
A fourth, more experimental, technique uses a device called a frequency comb. Frequency combs were invented to build ultra-accurate atomic clocks, but they have proved excellent at recognizing molecules floating in the air.
A frequency comb is essentially a laser that emits light at thousands of fine-tuned colors, or wavelengths, at once. In atomic clocks, these comb “teeth” are used to measure the color of a laser that’s tuned to a frequency at which an atom absorbs light.
To measure greenhouse gases, scientists shine the multicolored comb light through the air toward a mirror, which reflects the light back to its source, where the various wavelengths are measured using a second frequency comb. In an alternate setup, the comb colors hit a telescope and are detected and measured there.
As in the previous examples, this dual-frequency comb technique uses the fact that greenhouse gases in the air selectively remove certain colors. Because the comb puts out thousands of colors rather than just one, it can measure concentrations of numerous gases at once. It can be as accurate as CRDS.
Frequency combs can also measure the concentrations over a several-square-kilometer area, rather than just in one location or, as in the case of satellites and airplanes, in a vertical column of air.
This makes the frequency comb method a candidate for measuring methane emitted by large, dispersed sources such as oil and gas fields, cattle feedlots, landfills and wastewater treatment plants, and for tracking greenhouse gas emissions in urban areas.
Read more about how frequency combs are used to measure greenhouse gases.

Myriad Methods; One Goal
Greenhouse gas measurement has come a long way since Charles Keeling. Scientists now measure these gases all over the world, at high precision, from the ground, from the air and from space. In the coming years, these measurements will help governments, companies and others pinpoint the sources of greenhouse gases and monitor the impacts of efforts taken to reduce emissions. Ultimately, they may help reduce the amounts of these gases in the atmosphere — a goal of global importance, and one many decades in the making.