
Official websites use .gov
A .gov website belongs to an official government organization in the United States.
Secure .gov websites use HTTPS
A lock (
) or https:// means you’ve safely connected to the .gov website. Share sensitive information only on official, secure websites.
Test_33
| Name | Test_33
|
|---|---|
| Date | |
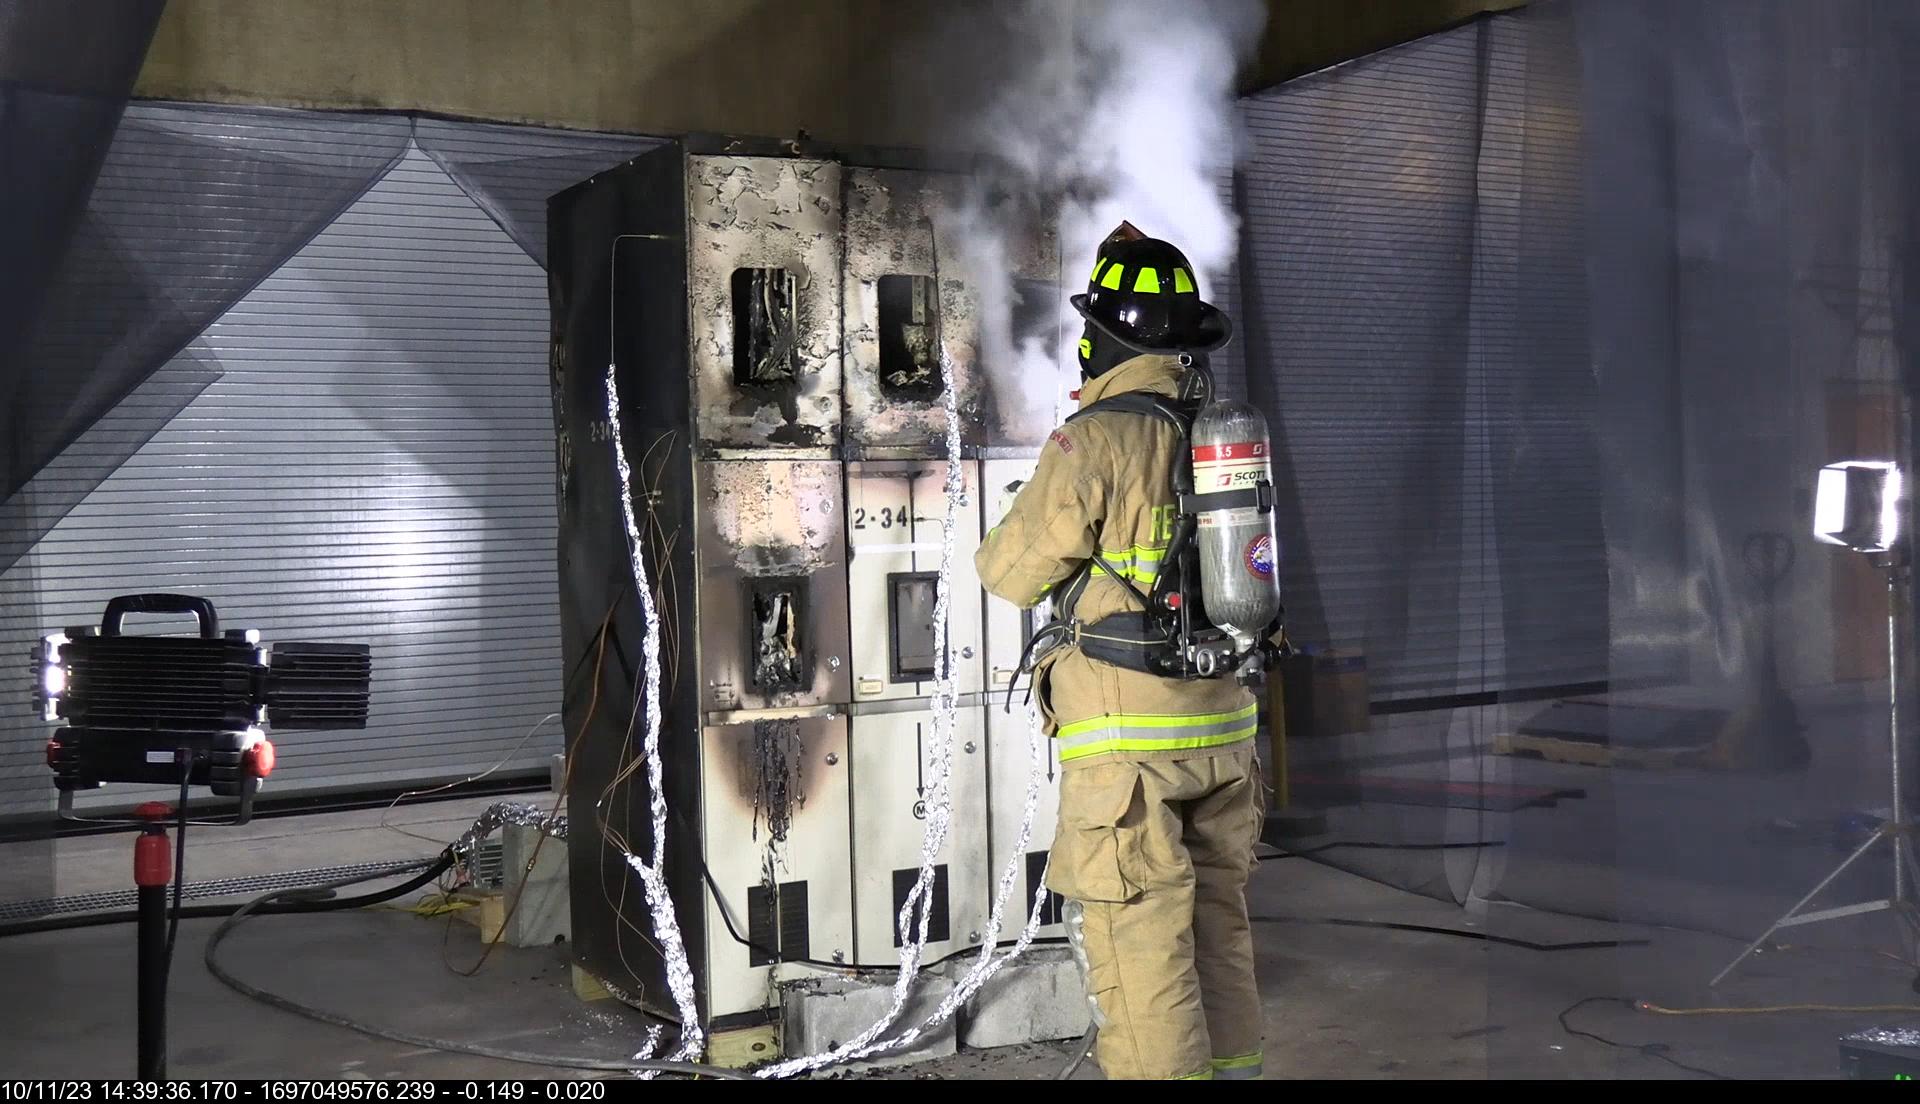
| Description | Low voltage switchgear cabinet w/ 100kW natural gas burner below the left breaker. Water cooled camera pointed at burner. |
| Specimen | Box Burner
|
| Ignition | pilot flame
|
| Project ID (s) | |
| Test Director | McGrattan
|
Timelapse Video with Heat Release Rate Plot
| Measurement | Value | Uc | Unit |
|---|---|---|---|
| Peak Heat Release Rate, PHRR
|
349
|
19
|
kW
|
| Time to Peak Heat Release Rate
|
10.93
|
0.07
|
min
|
| Total Heat Released, THR
|
460
|
29
|
MJ
|
| Gas Burner Total Heat Released, NGTHR
|
52.19
|
0.74
|
MJ
|
| Heat Release Quality Confirmation, HRQC
|
Not measured | - | MJ/MJ
|
| Net Specimen Mass (gravimetric), NM = Mi-Mf
|
Not measured | - | kg
|
| Total Fuel Mass Burned, TFM = THR / HOCf
|
9.19
|
0.65
|
kg
|
| Net Effective Heat of Combustion = THR / NM
|
Not measured | - | MJ/kg
|
| O2 Yield = O2 Consumed / TFM
|
3.80
|
0.29
|
kg/kg
|
| CO2 Yield = CO2 Generated / TFM
|
3.82
|
0.30
|
kg/kg
|
| CO Yield = CO Generated / TFM
|
0.237
|
0.019
|
kg/kg
|
| Soot Yield = Soot Generated / TFM
|
0.105
|
0.021
|
kg/kg
|
| Baseline Hood Exhaust Flow
|
12.91
|
0.39
|
kg/s
|
| Test Duration = Time(Fire Out) - Time(Ignition)
|
78.58
|
0.03
|
min
|
Uc = Combined Expanded Uncertainty with 95% confidence level
| Parameter | Value | Uc | Unit |
|---|---|---|---|
| Fuel Type
|
Natural Gas
|
- | - |
| Hood Size
|
6
|
- | m
|
| Effective Duct Diameter
|
1.975
|
0.005
|
m
|
| Exhaust Flow Correction Factor
|
1.055
|
0.034
|
- |
| Net Heat of Combustion (per unit mass O2), Ef
|
12.54
|
0.50
|
MJ/kg
|
| Net Heat of Combustion(per unit mass fuel), HOCf
|
50.00
|
1.50
|
MJ/kg
|
| Initial Specimen Mass, Mi (gravimetric)
|
Not measured | - | kg
|
| Final Specimen Mass, Mf (gravimetric)
|
Not measured | - | kg
|

| Event | Time (min) | Description | Video Snapshot Image |
|---|---|---|---|
| 1
|
0.00
|
Ignition
|

|
| 2
|
9.33
|
100 kW to 50 kW
|

|
| 3
|
10.62
|
Gas Burner OFF
|

|
| peak
|
10.93
|
Peak HRR
|

|
| 4
|
17.20
|
Hood Flow: from 12 kg/s to 20 kg/s
|

|
| 5
|
17.88
|
spread to upper cabinet
|

|
| 6
|
38.47
|
upper right panel melted
|

|
| 7
|
75.00
|
clock failure
|

|
| 8
|
75.63
|
water suppression
|
|
| 9
|
78.58
|
Fire Out
|

|
Table 5. Supplemental Data Plots


Bryant, R. and Bundy, M. The NIST 20 MW Calorimetry Measurement System for Large-Fire Research, Technical Note (NIST TN) 2077, 2019
https://doi.org/10.6028/NIST.TN.2077
NIST Fire Calorimetry Database (FCD)
https://doi.org/10.18434/mds2-2314