
Official websites use .gov
A .gov website belongs to an official government organization in the United States.
Secure .gov websites use HTTPS
A lock (
) or https:// means you’ve safely connected to the .gov website. Share sensitive information only on official, secure websites.
Vehicle3
| Name | Vehicle3
|
|---|---|
| Date | |
| Description | 2010 blue hybrid sedan mass = 1274 kg. Li-Ion Battery removed. 6 gallons of gasoline in fuel tank. Primary ignition with 1 liter kerosene soaked rags to ignite the 6 cm bed of pine straw mulch (21.0 kg) under car. |
| Specimen | Compact Hybrid Vehicle
|
| Ignition | kerosene soaked rags
|
| Project ID (s) | |
| Test Director | Hamins
|
Timelapse Video with Heat Release Rate Plot
| Measurement | Value | Uc | Unit |
|---|---|---|---|
| Peak Heat Release Rate, PHRR
|
8,527
|
507
|
kW
|
| Time to Peak Heat Release Rate
|
11.95
|
0.07
|
min
|
| Total Heat Released, THR
|
7,817
|
489
|
MJ
|
| Gas Burner Total Heat Released, NGTHR
|
1
|
- | MJ
|
| Heat Release Quality Confirmation, HRQC
|
Not measured | - | MJ/MJ
|
| Net Specimen Mass (gravimetric), NM = Mi-Mf
|
241.2
|
5.7
|
kg
|
| Net Effective Heat of Combustion = THR / NM
|
32.4
|
2.2
|
MJ/kg
|
| O2 Yield = O2 Consumed / NM
|
2.388
|
0.095
|
kg/kg
|
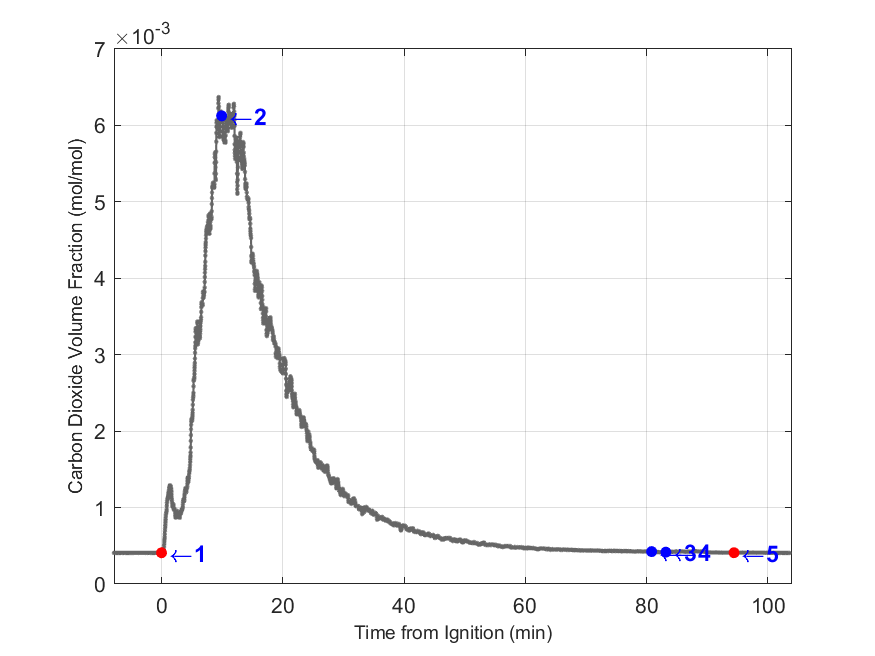
| CO2 Yield = CO2 Generated / NM
|
2.38
|
0.10
|
kg/kg
|
| CO Yield = CO Generated / NM
|
0.0436
|
0.0019
|
kg/kg
|
| Soot Yield = Soot Generated / NM
|
0.0417
|
0.0054
|
kg/kg
|
| Baseline Hood Exhaust Flow
|
73.4
|
2.2
|
kg/s
|
| Test Duration = Time(Fire Out) - Time(Ignition)
|
94.42
|
0.03
|
min
|
Uc = Combined Expanded Uncertainty with 95% confidence level
| Parameter | Value | Uc | Unit |
|---|---|---|---|
| Fuel Type
|
Generic
|
- | - |
| Hood Size
|
15
|
- | m
|
| Effective Duct Diameter
|
2.424
|
0.009
|
m
|
| Exhaust Flow Correction Factor
|
1.042
|
0.032
|
- |
| Net Heat of Combustion (per unit mass O2), Ef
|
13.10
|
0.66
|
MJ/kg
|
| Net Heat of Combustion(per unit mass fuel), HOCf
|
25.00
|
7.50
|
MJ/kg
|
| Initial Specimen Mass, Mi (gravimetric)
|
1,295.00
|
4.00
|
kg
|
| Final Specimen Mass, Mf (gravimetric)
|
1,053.78
|
4.00
|
kg
|

| Event | Time (min) | Description | Video Snapshot Image |
|---|---|---|---|
| 1
|
0.00
|
Ignition
|

|
| 2
|
9.92
|
loud bangs from air bag
|

|
| peak
|
11.95
|
Peak HRR
|

|
| 3
|
80.82
|
start water suppression of hot spots
|

|
| 4
|
83.17
|
remove magnesium hunk
|

|
| 5
|
94.42
|
Fire Out
|

|
Table 5. Supplemental Data Plots


Bryant, R. and Bundy, M. The NIST 20 MW Calorimetry Measurement System for Large-Fire Research, Technical Note (NIST TN) 2077, 2019
https://doi.org/10.6028/NIST.TN.2077
NIST Fire Calorimetry Database (FCD)
https://doi.org/10.18434/mds2-2314