Summary
The ability to predict signal strength has many applications in the telecommunications industry. The difference(in dB) between the transmitted and received power of a radio signal is known as path loss. Free space path loss is the loss in signal strength assuming a direct line-of-sight path through frees pace with no obstacles. In addition to free space path loss, there are also losses in received signal strength due to reflection, diffraction and scattering. The amount of loss due to these causes is dependent upon the amount and type of "clutter" in the environment between the transmitter and receiver. One goal of the project is to come up with a clutter metric that could be used for predicting path loss.
Description
The Irregular Terrain Model (ITM) is a model for radio propagation that has been widely used for predicting the attenuation of a radio signal as a function of distance and the variability of the signal in time and in space. It was developed in the 1960 sand therefore does not fully utilize the computing capabilities or technology that exists today. A question that arose early in this project was to determine whether we could model path loss more accurately using simple statistical models.
Major Accomplishments
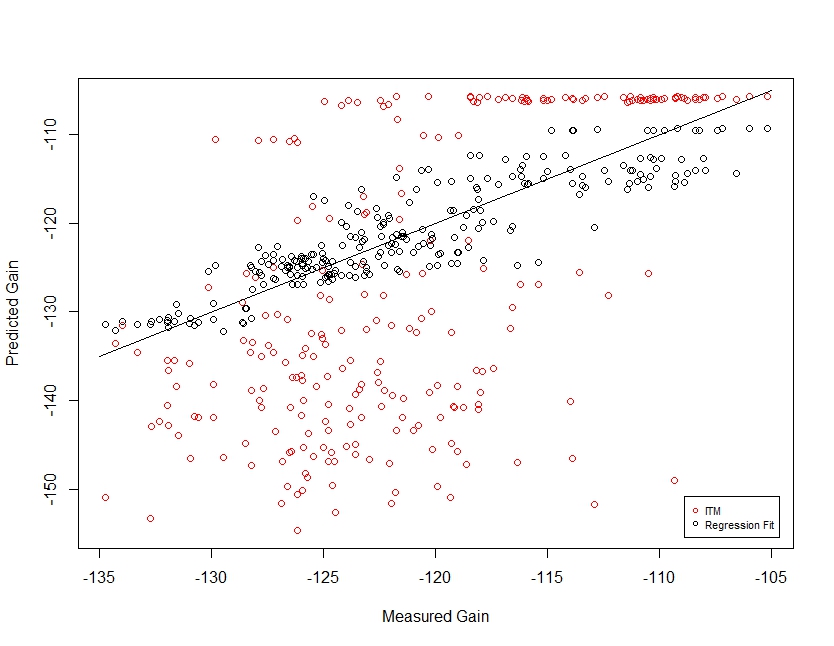
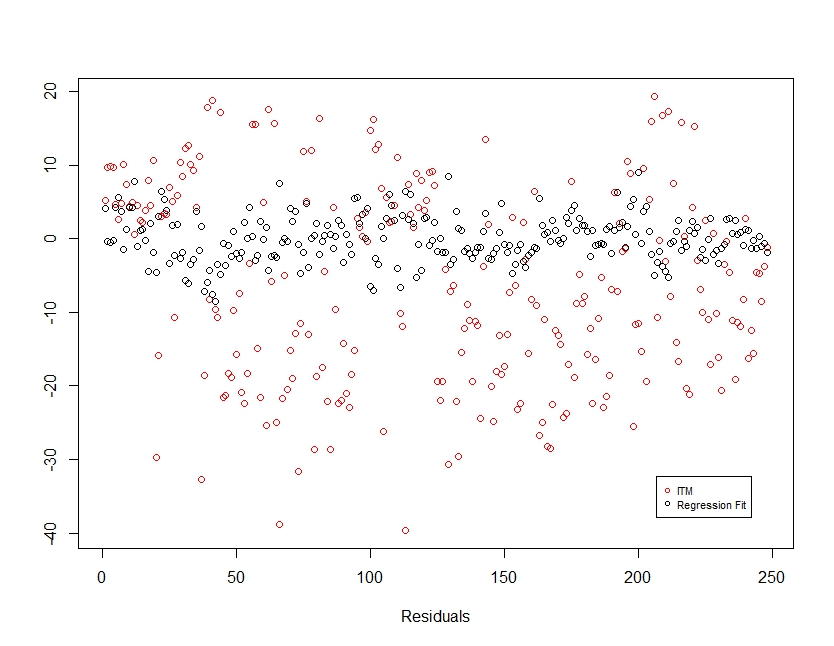
Signal strength data from an experiment based in the Boulder, Colorado,area were used to examine the relationship between path loss, distance between the transmitting antenna (fixed) and receiver (mobile) and the surrounding environment. Lidar profile data at a 10 meter resolution were interpolated to give a 2-dimensional profile along the line-of-sight path between the transmitter and receiver. Using this data set, a promising predictor involves the number of Fresnel zone crossings along this line of site path. The Fresnel zone is the area around the line-of-sight line that radio waves spread into after leaving the antenna. Initial results show that a linear regression model using distance and a function of the Fresnel zone crossings as predictors to be a significant improvement over the predictions from the ITM model. A scatterplot of the predictions from ITM (red) as well as the regression model (black) against the measured path gain is depicted in Figure 1. Figure 2 shows the corresponding residuals.

Figure 1. Scatterplot of predictions from ITM (red) and regression model (black) against measured path loss.

Figure 2. Residuals from ITM (red) and regression model (black).
These initial results indicate that a larger percentage of the variability in the measured path losses is explained using a function of the Lidar data and distance than when using ITM output based on the same Lidar data. How well this model performs in other areas or under different scaling are open questions. Current research is focused on exploiting these relationships in an effort to predict path loss based upon the type of clutter present.

