Summary
The PBD is making new, state-of-the-art measurements of the wavelengths of select atomic X-ray emission lines. These measurements underpin all precision x-ray diffraction work.
Description

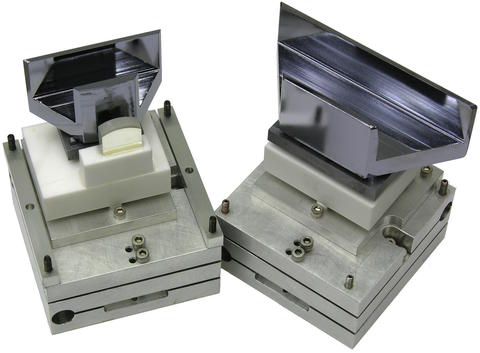
This shows the two crystals used for precision wavelength measurements. The smaller crystal is mounted on the center stage of the PBD. The larger crystal is mounted in front of the x-ray camera, on the outer stage. The aluminum bases are approximately 5 cm wide. The small 'tombstone' shaped mirror visible on the small crystal is used for preliminary optical alignment; there is a corresponding one on the back side of the large crystal.
Precise knowledge of the shape and position of x-ray emission lines is the basis of connecting x-ray diffraction measurements to the Système Internationale d'Unités (SI), the official worldwide standard for making any measurement. Measurements of position of x-ray emission lines have been made been made over a long period of time. However, it was not until the work of Deslattes et al. at NIST on the x-ray optical interferometer (XROI) (see, for example, Update on crystal lattice measurements at NIST), that provided an absolute measurement of the lattice constant of silicon, that these measurements have been able to be made in a manner directly traceable to base units of the SI. This connection is made via Bragg's law, that connects the lattice constant d of a crystal to the diffraction angle θ and the x-ray wavelength λ: λ=2 d sin(θ). Since then, very few measurements of absolute line positions have been made, and improvements in technology have made it possible to improve on those measurements.
During the commissioning of the PBD, we came to realize that it had become the most precise angular platform in the world available to the diffraction community. The space in which it is located is ideally suited to precision X-ray line measurements, since it is very well temperature controlled, to 0.01C, and isolated from most sources of environmental interference. By mounting silicon crystals with SI-traceable lattices, we have a system which can make wavelength measurements. The use of an X-ray camera to digitize the diffracted X-rays makes it possible to characterize the optical aberrations which have previously set limits on such measurements.
Mounting 2 3-bounce channel-cut silicon crystals on the PBD stages allows us to use the system as a modified double-crystal diffractometer (DCD). The crystals can be rotated into non-dispersive mode, providing an absolute measurement of the angular relation between the crystals (the diffracting planes are exactly antiparallel in this configuration). Then, without disturbing the system, they can be rotated into dispersive mode, which results in the instrument acting as a very narrow-band x-ray monochromator, with the transmitted energy being determined from the very well known angles via Bragg's law. By scanning the angle between the crystals, one can measure the intensity of the x-ray emission from an x-ray source as a function of wavelength. The energy scale which results from this work is accurate to ΔE/E < 0.5 ppm, within k=2 expanded uncertainty (approximately 95% confidence limits).
Major Accomplishments
Work carried out in 2015 and 2016 made measurements of the x-ray emission spectrum of the copper Kα complex, one of the most widely used lines for diffraction work. In 2018, we published a spectrum for molybdenum, including KL, KM, and KN lines. Molybdenum is a high-energy X-ray source, useful for probing high-atomic number materials and thick specimens. We are preparing to measure the spectrum of other important X-ray lines.
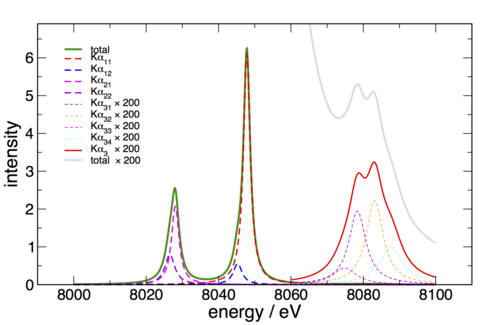
The structure of the copper Kα complex, as measured during the 2016 run, is as shown in the figure below. Kα1 and Kα2 are repesented as a sum of 2 Lorentzian components each. The Kα3-4 "satellite" is a sum of 4 Lorentzians. It is scaled up vertically a factor of 200, since it is a very weak system.


